Data Notes
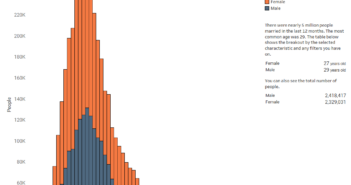
The data for this visualization comes from the American Community Survey. I used the 2021 1-Year Public Use Microdata Sample which can be found on the ACS Website. This visualization uses Tableau to show how marital status differs by age.
In addition to viewing the nation as a whole, you can filter the data by reported sex, race and ethnicity, educational attainment, and geographic region. There are also the ability to adjust the chart type between lines and stacked bars. You can also switch between number of people or percentage of age.
If you are interested in finding out more about this data or how the Census Bureau defines “Regions” you can find it on the Census Bureau’s website.


