Data Notes
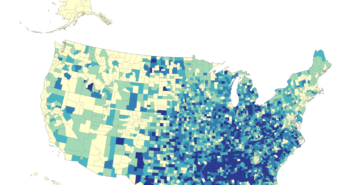
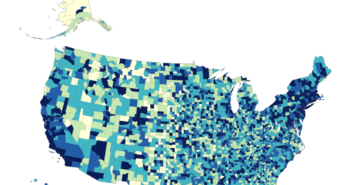
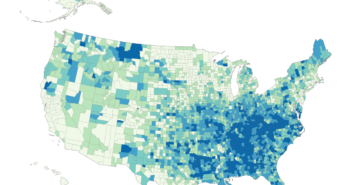
Understanding the well-being of a county goes beyond traditional measures of poverty, housing, and educational attainment. This data visualization delves into the often-overlooked demographics of the elderly population in the United States. Utilizing data from the Census Bureau’s 2022 American Community Survey 5-year estimates, we explore the percentage of population that is 65 and older, 85 and older, and 62 and older.
The visualization was created using Tableau after scraping data from the U.S. Census Bureau’s API with Python.
Follow @overflow_data on X or on Instagram for our most recent visualizations.


