Visualization
Data Notes
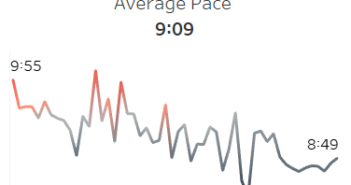
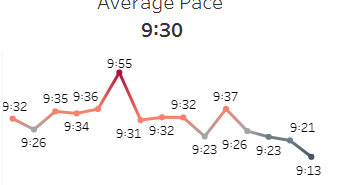
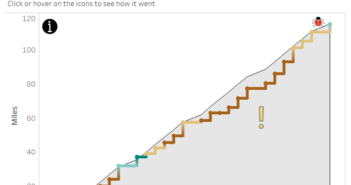
This visualization represents some of the metrics I am tracking on my nearly cross country road trip. As we go I will update the data in a google sheet. The visualization is created using Tableau and hosted in Tableau Public.
I will be including some data tidbits and pictures of the things my family and I are doing along the way. You can find them on Facebook or Twitter. I will be embedding my tweets below.
If you want to keep up with our progress be sure to follow us on Twitter and Facebook.
Day 1 – July 7th, 2017
St. Mary’s County, Maryland
I, @chasesaw will be on the road the next few weeks, but the #dataviz won't stop. Here is some data about where I started, St Mary's Co. MD pic.twitter.com/GO11SPuakl
— Overflow Data (@overflow_data) July 7, 2017
Colonial Heights, Virginia
Started our road trip this morning, but had to stop for some @Hardees breakfast pic.twitter.com/KmfBYjKG9q
— R. Chase Sawyer (@chasesaw) July 7, 2017
Mecklenburg County, North Carolina
Almost to Charlotte, NC! Here is some info on Mecklenburg County, NC, the county that Charlotte is located in. #dataviz pic.twitter.com/GFkXclZOCb
— Overflow Data (@overflow_data) July 7, 2017
The sun setting on the Alabama State Capital in Montgomery, Alabama. pic.twitter.com/0b68m80Fzn
— R. Chase Sawyer (@chasesaw) July 8, 2017
Day 2 – July 8th, 2017
Mississippi Border
Made it to Mississippi. Only 9 hours to go. pic.twitter.com/zQo0L0e55f
— R. Chase Sawyer (@chasesaw) July 8, 2017
— R. Chase Sawyer (@chasesaw) July 8, 2017
I think I have a thing for state capitols. Here is the LA State Captiol building. pic.twitter.com/IUaAyGLJIe
— R. Chase Sawyer (@chasesaw) July 8, 2017
Day 3 – July 9th, 2017
Drove 1,600 miles in 41 hours and 57 minutes with 3 kids. What does former POTUS, @BarackObama think of that? #roadtrip #SummertimeGrind pic.twitter.com/v8rxOVq2DN
— R. Chase Sawyer (@chasesaw) July 9, 2017
Day 5 – July 11th, 2017
#44oz #buc-ees pic.twitter.com/7VnxM9ca3T
— R. Chase Sawyer (@chasesaw) July 11, 2017
#rememberthealamo pic.twitter.com/OZGT4zejkC
— R. Chase Sawyer (@chasesaw) July 11, 2017
Day 7 – July 13th, 2017
Got to visit the LBJ presidential library in Austin today! Had a great time! pic.twitter.com/LO8Lwj43HA
— R. Chase Sawyer (@chasesaw) July 14, 2017
Day 8 – July 14th, 2017
#roadTrip pic.twitter.com/u8J6w1ghM1
— R. Chase Sawyer (@chasesaw) July 14, 2017
#goodtimes #weirdal #RoadTrip pic.twitter.com/rakzOXAUF0
— R. Chase Sawyer (@chasesaw) July 15, 2017
Day 9 – July 15th, 2017
Got to see 4 Corners today! Super cool experience for a dork like me. #roadtrip #4States@Once pic.twitter.com/spipkutoWj
— R. Chase Sawyer (@chasesaw) July 16, 2017
Day 10 – July 16th, 2017
You know your at grandma's house when the USSR is still on the globe. #SovietRussia #GrandmasHouse #GoodTimes pic.twitter.com/s95zITYl2G
— R. Chase Sawyer (@chasesaw) July 16, 2017
Day 11 – July 17th, 2017
#Utah #Government #StateCapitol pic.twitter.com/h4rOl4E70q
— R. Chase Sawyer (@chasesaw) July 18, 2017
The #dataviz creation spot for the next few days. pic.twitter.com/ABxr2dg9Az
— R. Chase Sawyer (@chasesaw) July 18, 2017
Day 14 – July 20th, 2017
Visiting the alma mater today #nostalgia #TheBetterBYU
— R. Chase Sawyer (@chasesaw) July 20, 2017
Day 18 – July 24th, 2017
What a beautiful wife I have. #RoadTrip #SouthDakota pic.twitter.com/UgK3Nnh0EU
— R. Chase Sawyer (@chasesaw) July 24, 2017
Meanwhile in South Dakota… @PokemonGoApp #GotPonyta #YesIStillPlay pic.twitter.com/U8UNsJfyMe
— R. Chase Sawyer (@chasesaw) July 25, 2017
The same rest stop IRL @PokemonGoApp #beautiful #USA #RoadTrip pic.twitter.com/4YmqRsnbXs
— R. Chase Sawyer (@chasesaw) July 25, 2017
Day 19 – July 25th, 2017
5 states today, highlight was seeing the Lds visitor center and Community of Christ temple in MO #RoadTrip #church pic.twitter.com/vA5f8jddJ1
— R. Chase Sawyer (@chasesaw) July 26, 2017
Day 20 – July 26th, 2017
Made it to the arch. Only 13 more hours till home. #RoadTrip #MeterMaidDidntLookHappy #arch pic.twitter.com/PDwVicnD7E
— R. Chase Sawyer (@chasesaw) July 26, 2017
Left an exeggutor in rural Wyoming… @PokemonGoApp #ShouldHaveSeenThatComing #RoadTrip #NoCoinLimit pic.twitter.com/kNPyNJjLGm
— R. Chase Sawyer (@chasesaw) July 26, 2017
Day 21 – July 27th, 2017
Why did they name it West Virginia? Because one Virginia wasn't enough. 😜#dadjokes #RoadTrip #AreWeHomeYet
— R. Chase Sawyer (@chasesaw) July 27, 2017
Hopefully our last McDonald's visit for awhile #RoadTrip #NeedRealFood #GoingOnADiet pic.twitter.com/iWSmQEjcwk
— R. Chase Sawyer (@chasesaw) July 27, 2017
Finally back. #TheEnd #RoadTrip pic.twitter.com/5z335wWUfe
— R. Chase Sawyer (@chasesaw) July 28, 2017


