
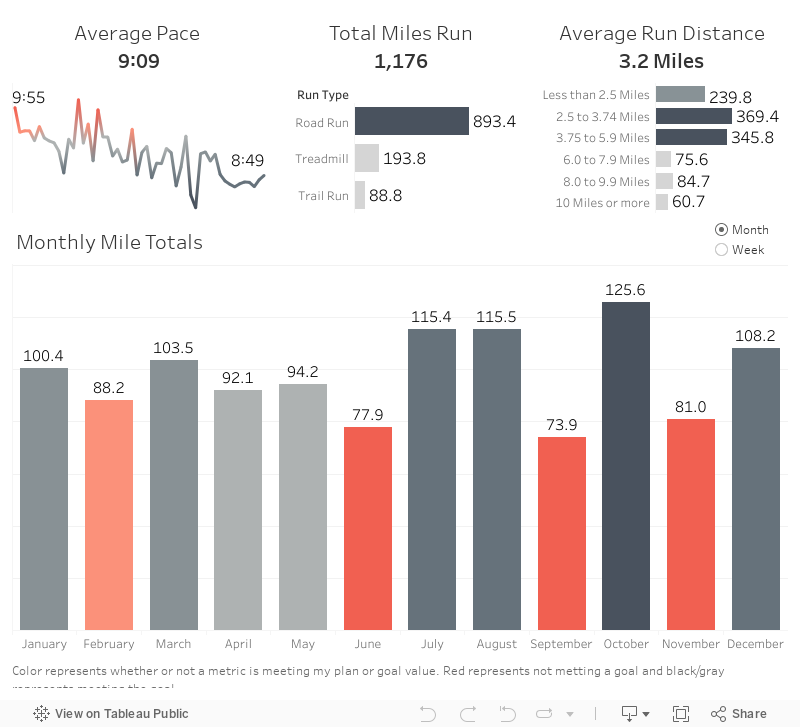
Over the last few years, I have been working to increase my running abilities. Something that has helped me is to create visualizations to track my progress and how I am doing. In 2023, I had goals to run faster and more miles than I had before. I wanted to have an overall pace under 9:15 per mile and run more than 1080 miles in the year or 90 miles a month.
This dashboard has helped me keep track of my goals each week and month to make sure I was keeping pace. As you can see, I was able to shatter those goals and I look forward to what I will be able to acheive in 2024. If you have data that we might be able to help you organize and evaluate, reach out to us on Twitter or via email. We love organizing and displaying all types of data.
To create this visualization, I used my Fitbit to track my runs. I then utilized the Fitbit API and some Python code to curate the data, I did some final data manipulations in Tableau Prep. Finally, I used Tableau Public to create and host the visualization.