
Visualization
Data Notes
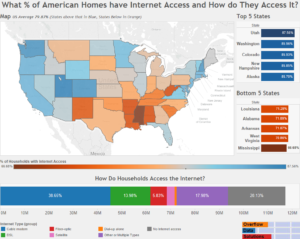
The data for this visualization comes from the United States Census Bureau. It is gathered during the American Community Survey. I used 2014, 5 Year Estimates for each county. The data can be found at American FactFinder under Table B14004.
If you want to keep up with our surveys and data analysis, be sure to follow us on Twitter and Facebook.
Up Next
What % of American Households have Internet Access?
Leave a Reply