What Percentage of Workers in the U.S. Work From Home?
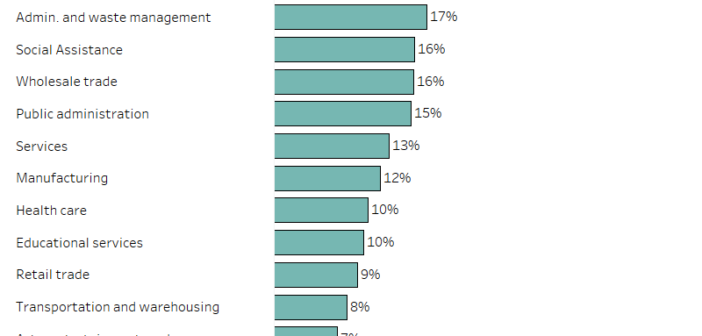
Explore social, economic, and demographic trends in the transformed remote work with this data visualization.

Explore social, economic, and demographic trends in the transformed remote work with this data visualization.

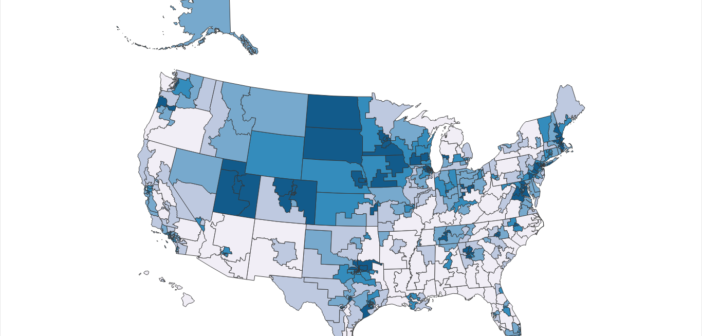
Understand how employment is different in each congressional district by using this data visualization.

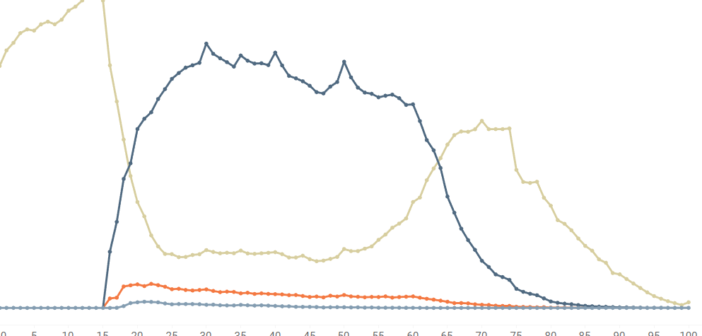
When you start and stop working has a lot to do with your age. This data viz shows how employment can differ by age for the average American.

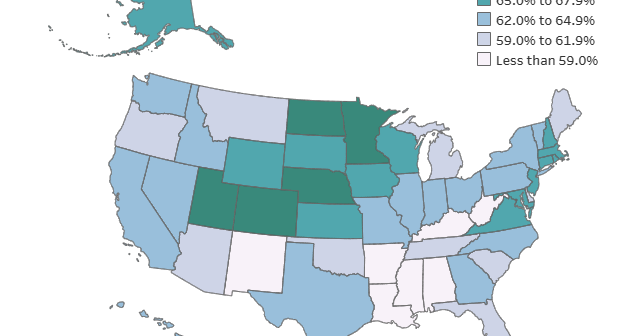
Unemployment rate isn’t the only way to measure health of the nation’s labor force. This tool looks at three different measures.