
The State of Connectivity: Broadband Access by State
A look at broadband internet access in each state in the U.S.
A look at broadband internet access in each state in the U.S.
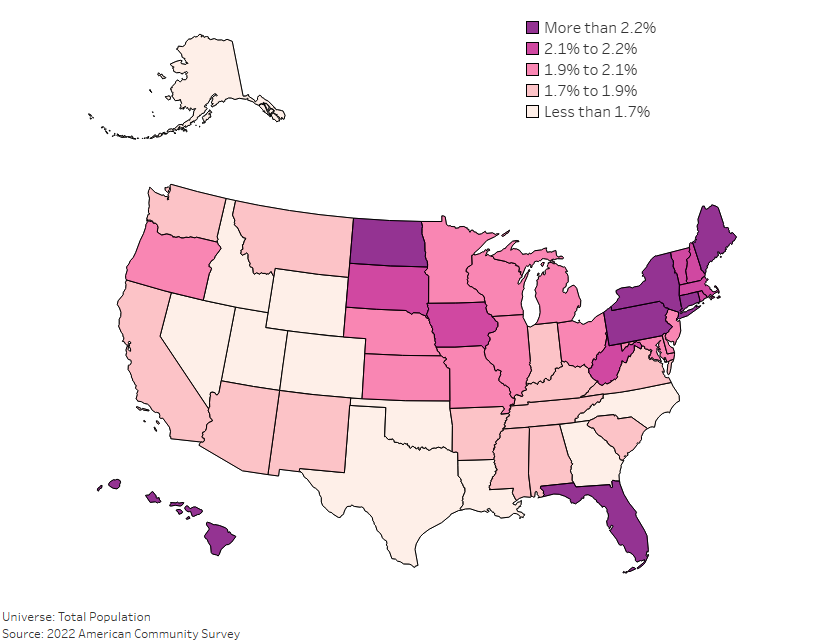
As America continues to shift demographically, the aging population has become a much larger focus for policy makers. Understanding where the oldest Americans live, and […]
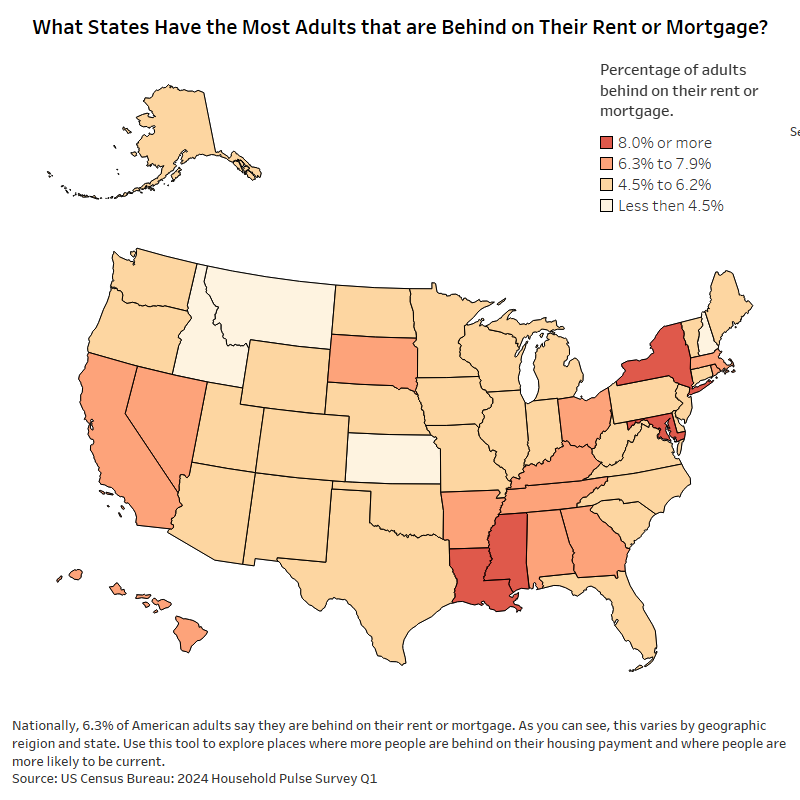
Introduction Understanding where the most people are falling behind on their rent or mortgage is a key part of grasping the bigger picture of housing […]
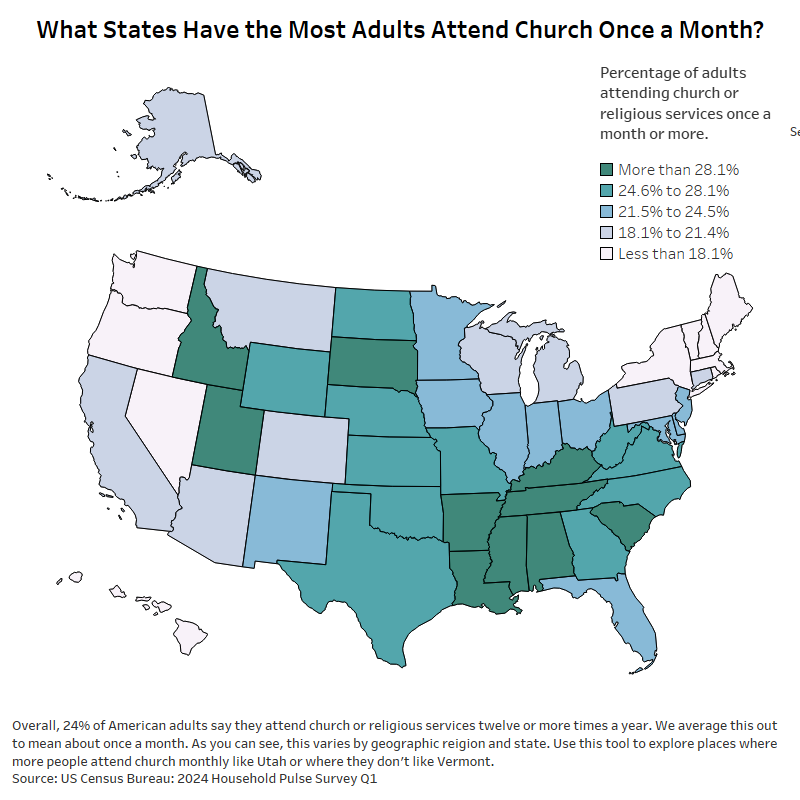
In Q1 of 2024, 24% of adults attended church monthly in the US. This tool shows how that varies state. States such as Utah lead the way.
Copyright © 2026 | WordPress Theme by MH Themes