Source
The data for this visualization comes from the American Community Survey which is conducted by the US Census Bureau. One year estimates from 2005-2014 were used to complete the time series. They can be found on American Fact Finder on table B25003. US Census Regions were utilized in this graphic. More information about census regions can be found here.
After downloading the data I created the time series in excel. Tableau was then used to create this visualization.
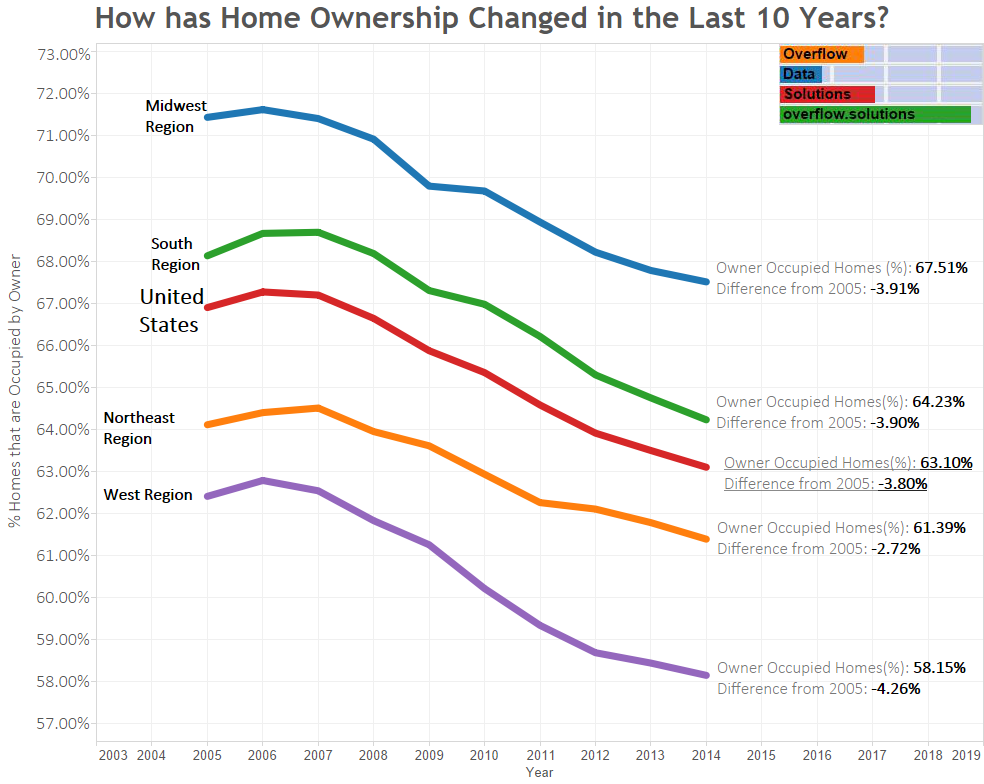
Would have loved to see this from even earlier. Looks like people on the west coast felt this move the most.