Introduction
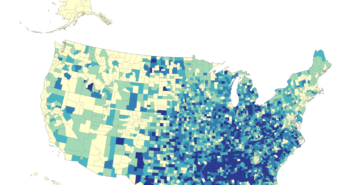
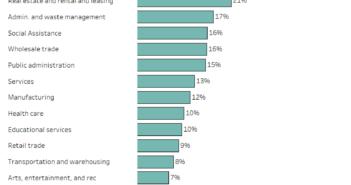
More and more people working at home because of the COVID-19 outbreak. We thought it would be interesting to explore how many people were regularly working at home before the pandemic. The U.S. Census Bureau’s American Community Survey estimated in 2018 that 5.3% of workers worked at home on a regular basis. You can use this visualization to see what percentage of workers work at home regularly in each metro area.
Data Visualization
Data Notes
I gathered the data for this visualization from the U.S. Census Bureau’s API. We have this data because it is provided from Census’s 2018 American Community Survey 1-year estimates. After I scraped the data from the API using Spyder, I then used Tableau Public to create this visualization. If you want to learn more about COVID-19 and commuting, we have various visualizations about these topics throughout our website.


