Visualizations
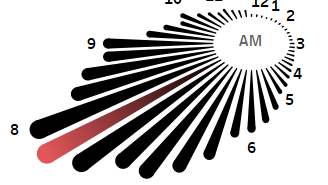
Note for Mobile Users: The graphics above are a static version of a dynamic visualization. We hope you take the time to return to our site on your desktop or laptop computer to take advantage of the complete visualization.
Data Notes
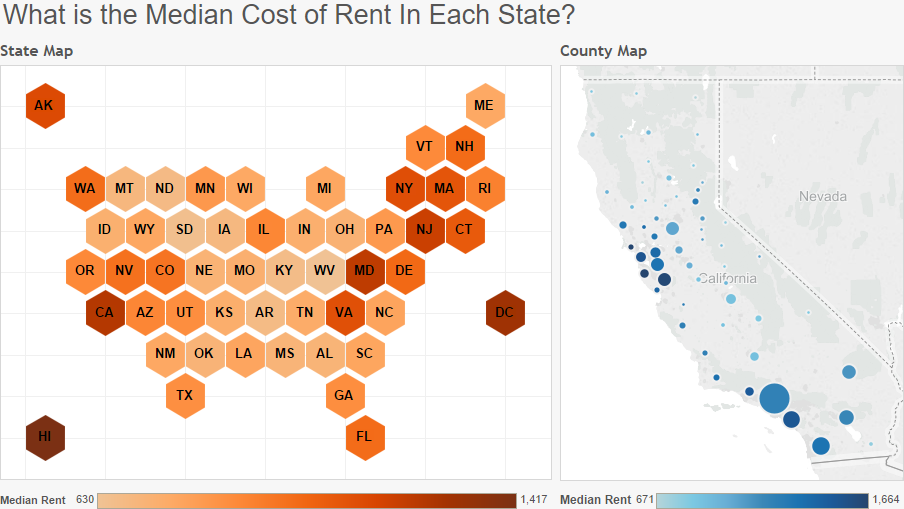
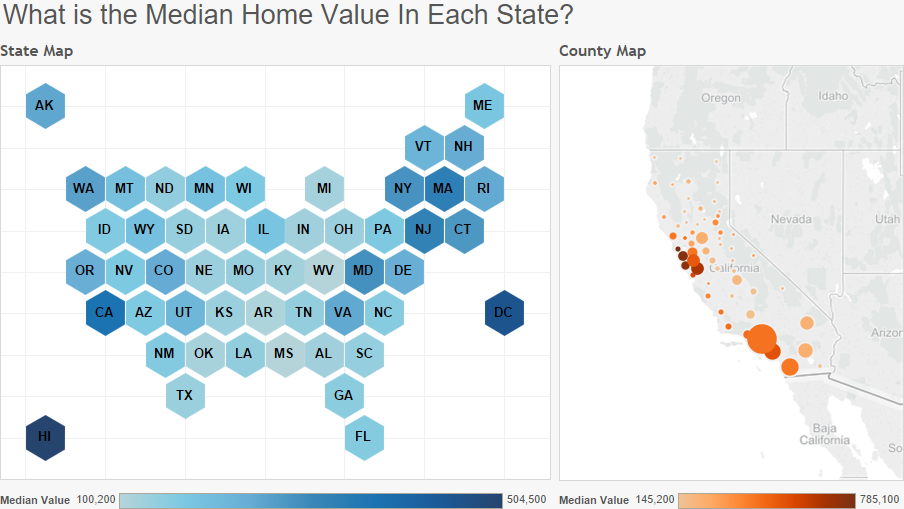
The data for this visualization is from the American Community Survey which is completed by the US Census Bureau. It can be found on AmericanFactFinder.gov under Table DP04. The 2010-2014 5 Year Estimates were used for this visualization. After I collected the data, I made minor edits in Excel. I then created the visualization using Tableau.
