Visualization
Source
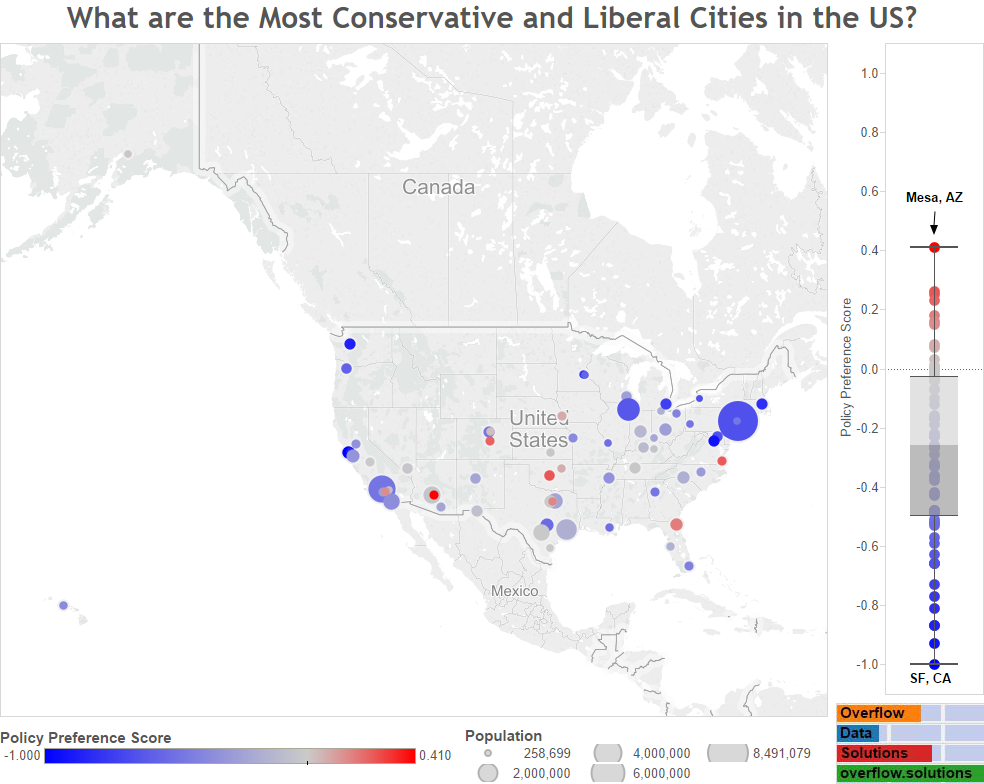
I originally found this data in a Forbes article. I did a little research on their methodology and found that they had taken the data from a MIT study about whether city officials were reactive to public opinion. They created a measure of how conservative each cities residents are for cities with more then 250,000. I then paired this with the 2014 US Census ACS Estimates for population.
After keying the data in excel. Tableau was then used to create this visualization.
