Visualizations
[accordions]
[accordion title=”Dot Chart” load=”show”]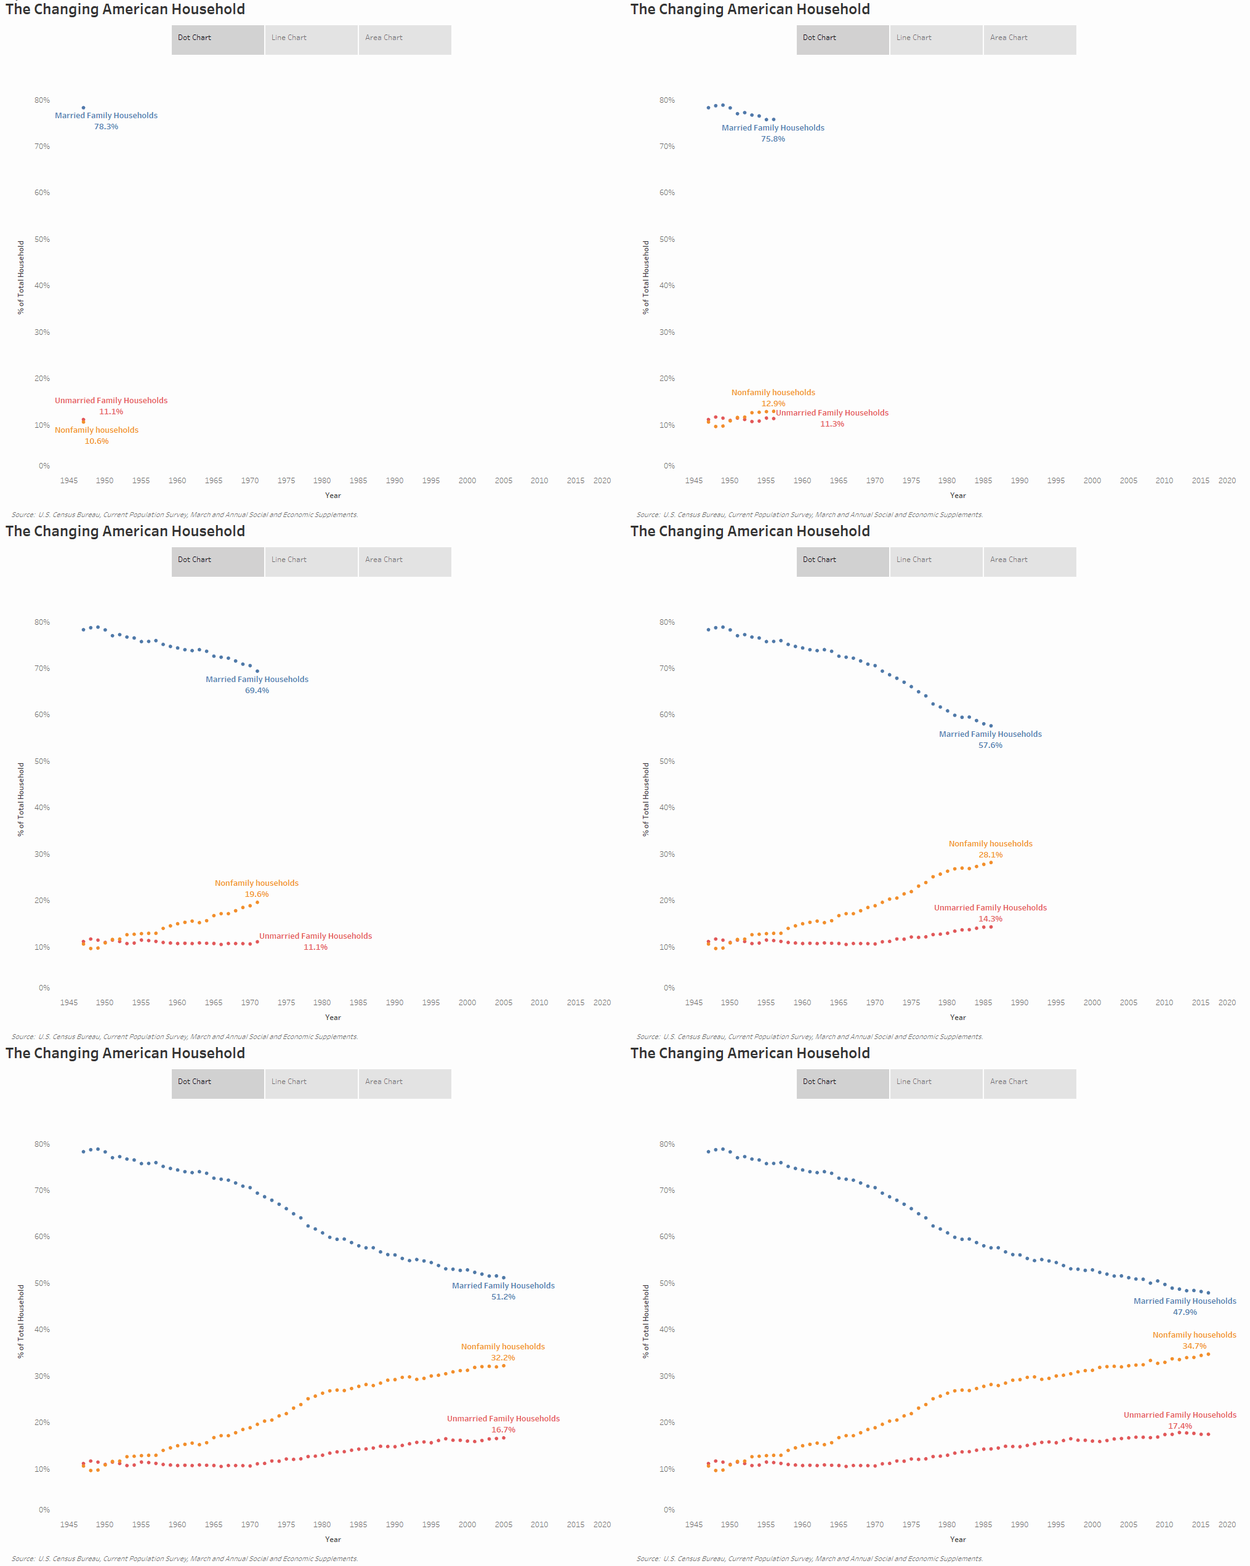 [/accordion]
[accordion title=”Area Chart” load=”hide”] 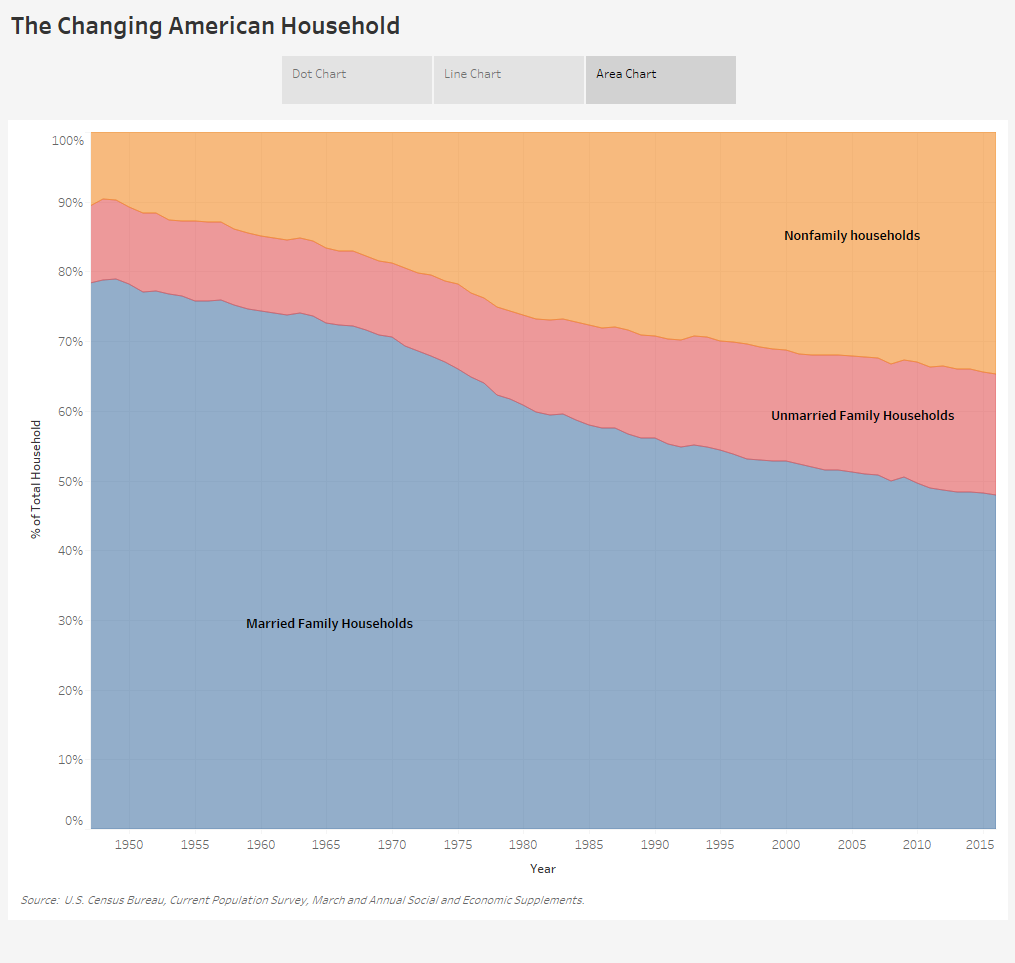 [/accordion]
[accordion title=”Line Chart” load=”hide”]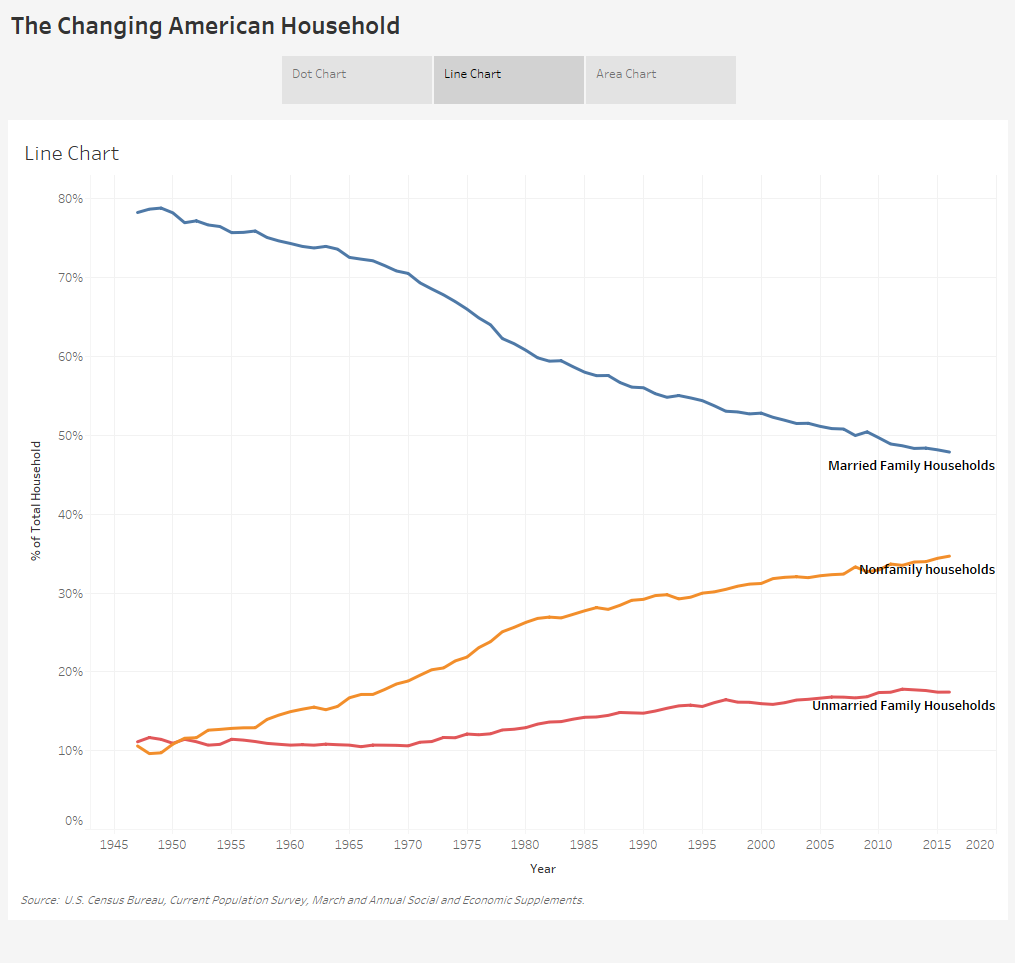 [/accordion]
[/accordions]
Data Notes
I am very interested in how American Households and families are changing so I created this visualization that shows how households are organized has changed over the last 70 years. I used data from the U.S. Census Bureau and Tableau to create this visualization. To better understand the categories, I have included definitions of these terms below. If you want to find out more about CPS definitions you can find them here.
Married Family Household: A household where a married couple owns or rents the home.
Non-Married Family Household: A household where the person who owns or rents the house is related to someone in the home, but the person is either unmarried or their spouse doesn’t live there.
Non-Family Household: A household where the person who owns or rents the household is not related to anyone else in the household. People who live alone are included in this type of household.
The Changing American Household #dataviz https://t.co/LTAzabw0oe pic.twitter.com/mHVPOpLG4g
— Overflow Data (@overflow_data) October 11, 2017
