Visualization
Data Notes
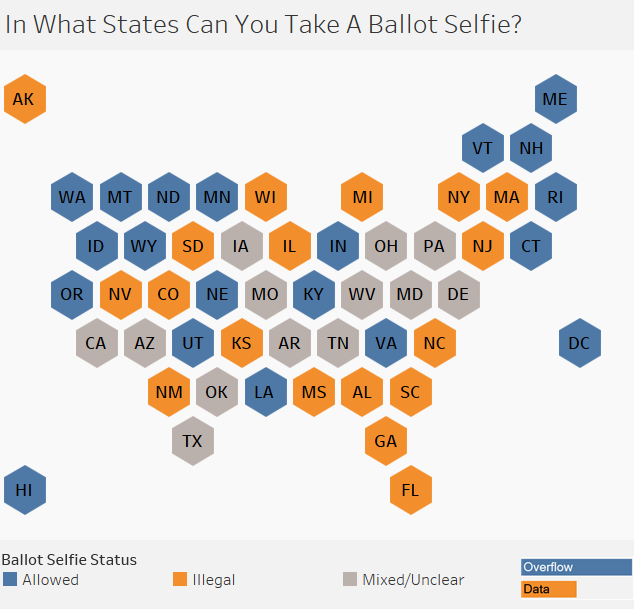
ABC News recently published a story where they detailed the various laws and statements from government officials about taking pictures of your ballot. I decided that this story would be a cool data visualization.
To make the visualization I went through the article and assigned each state a status as well as copied the quote from the article about this status. This was done in excel. I then used Tableau to create this data visualization. The hexagon map is something that I came across that on Sir Viz-A-Lot’s blog.
If you want to keep up with our surveys or data analysis be sure to follow us on Twitter and Facebook.
In What States Can You Take A Ballot Selfie? #datviz #ElectionDay #selfie https://t.co/hycrvVfu5K pic.twitter.com/FWDQlItvsg
— Overflow Data (@overflow_data) November 5, 2016


