[accordions]
[accordion title=”A Note for Mobile Users” load=”hide”]You have been automatically directed to this page because we detected you were using a mobile device. How to integrate mobile users in the visualization realm continues to be an issue for users and creators. At this current time we are only publishing desktop ready versions of our graphics. What you are currently seeing is a static version of the visualization. We hope that you use the sharing features below to facebook, tweet, or email yourself the link so you can enjoy the visualization and its interactivity later on.[/accordion]
[/accordions]
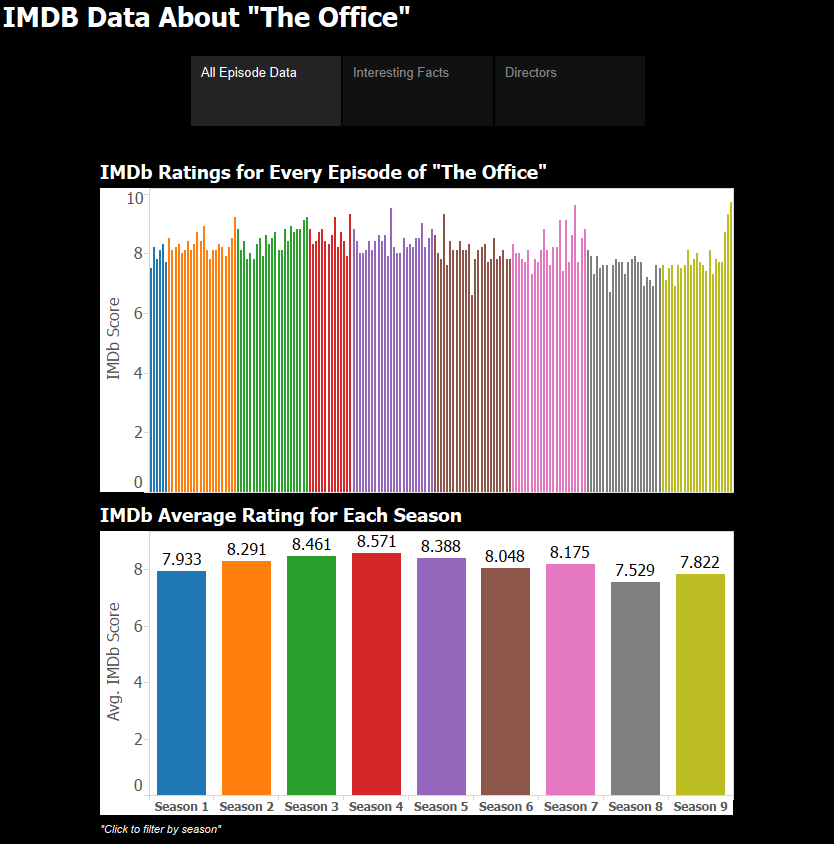
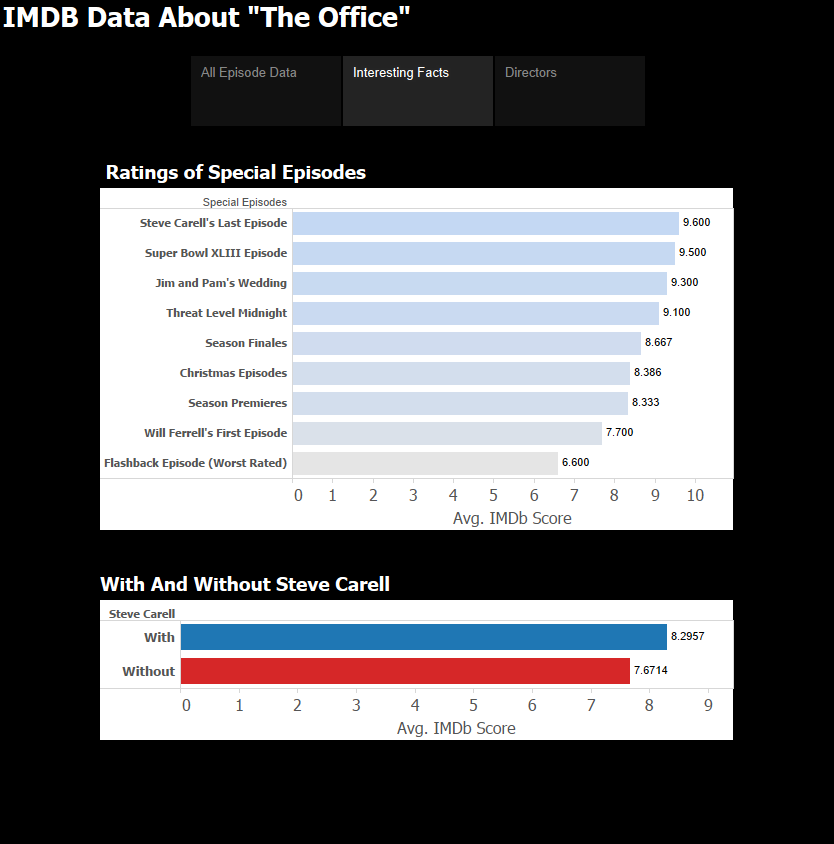
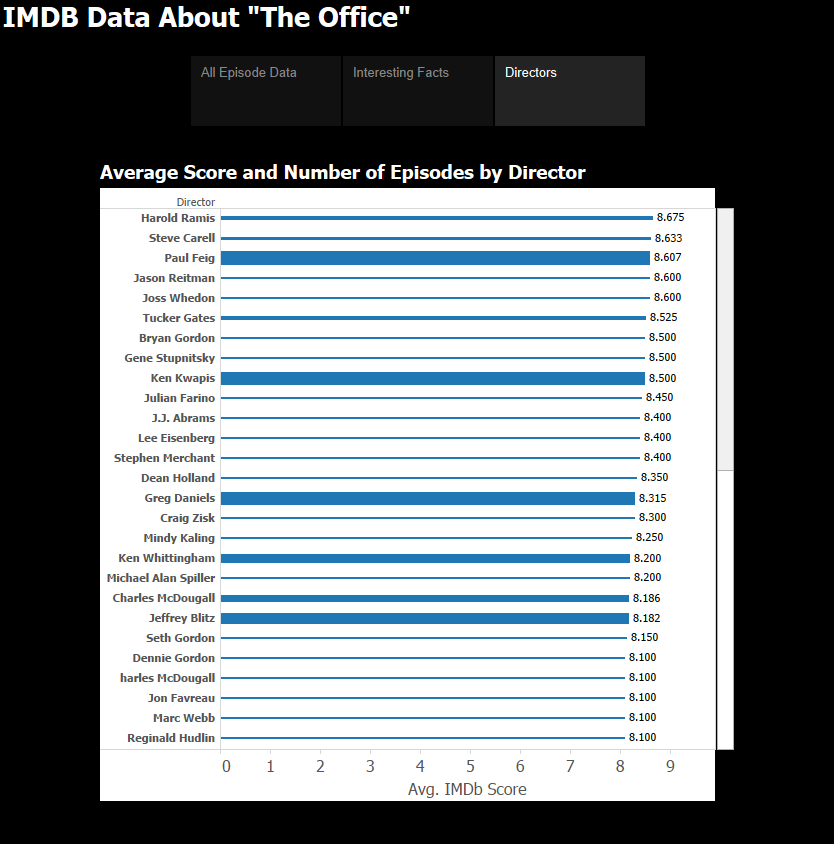
In my opinion, “The Office” is one of the best comedies ever. I wanted to see what everyone else thought so i transcribed all the data from IMDb so I could visualize it. Here you have IMDb data for every episode of “The Office” with visualizations of all the scores, special episodes, data on episodes with and without Steve Carell, and a breakout of scores by director. You can review the interactive graphic and quick facts below.
Quick Facts
Episodes
Highest Rated Episode: Finale, Season 9, IMDb Score 9.7
Lowest Rated Episode: The Banker, Season 6, IMDb Score 6.6
Seasons
Highest Rated Season: Season 4, IMDb Score 8.571
Lowest Rated Season: Season 8, IMDb Score 7.822
Directors
Highest Rated Director: Harold Ramis 4 Episodes IMDb Score 8.675
Lowest Rated Director: Claire Scanlon 2 Episodes IMDb Score 7.0
Most Episodes Directed: Randall Eingorn 15 Episodes IMDb Score 8.053
Notable Directors: J.J Abrams, 1 Episode, IMDb Score 7.6
Brian Cranston 1 Episode, IMDb Score 7.6
Source
The data was taken from the IMDb pages about “The Office” ,entered into excel, and then visualized in Tableau Public. The excel file is available below.
The Office Data Set
