Introduction
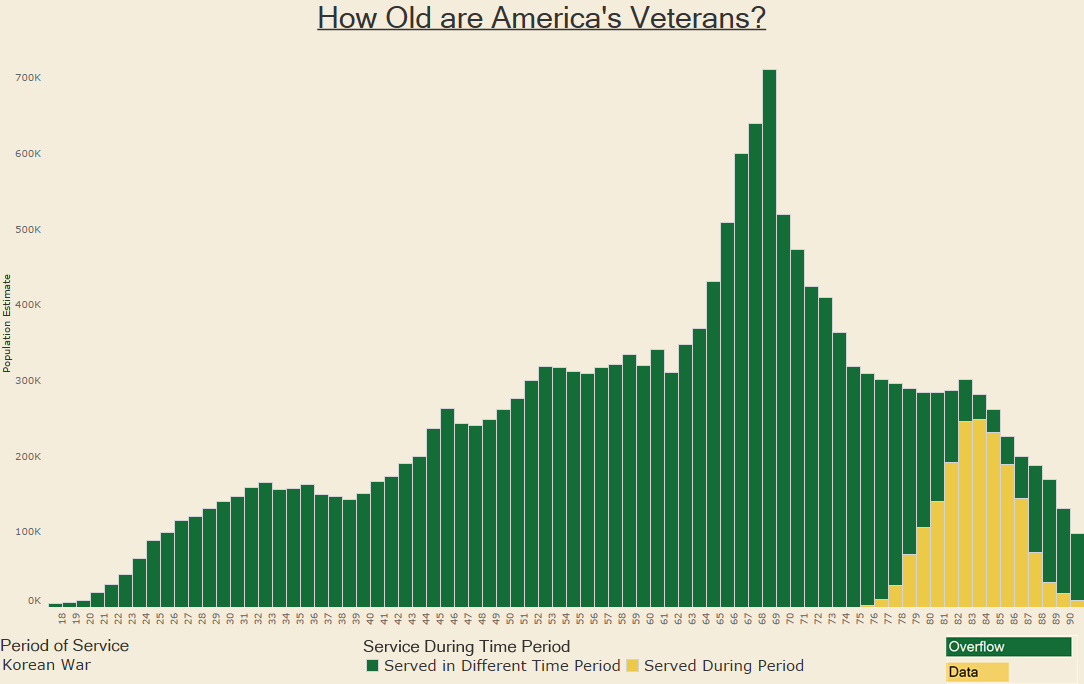
For Veterans Day, we decided to create a visualization recognizing our nations more than 18 million veterans. Using American Community Survey data we created this age distribution of those that have served in the armed forces. You can also isolate the group by period of service to see how many served in each time period.
Visualization
[accordions]
[accordion title=”September 2001 or Later” load=”show”]
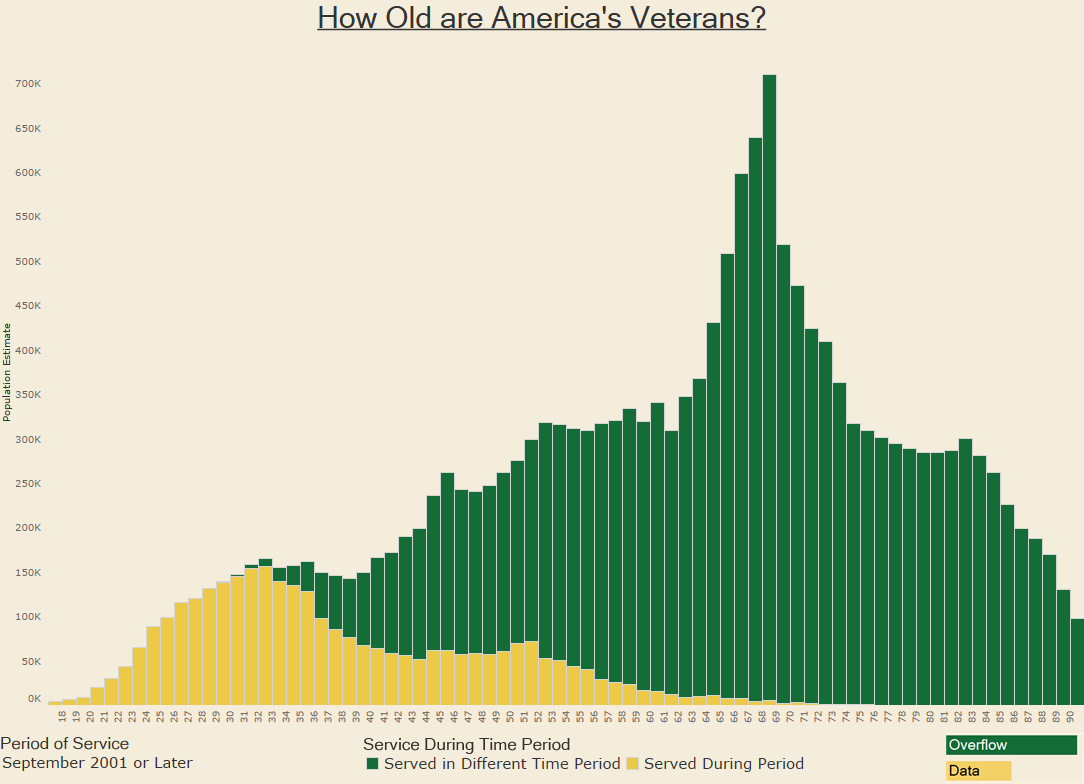 [/accordion]
[accordion title=”August 1990 – August 2001″ load=”hide”]  [/accordion]
[accordion title=”May 1975 – July 1990″ load=”hide”] [/accordion]
[accordion title=”Vietnam Era” load=”hide”] 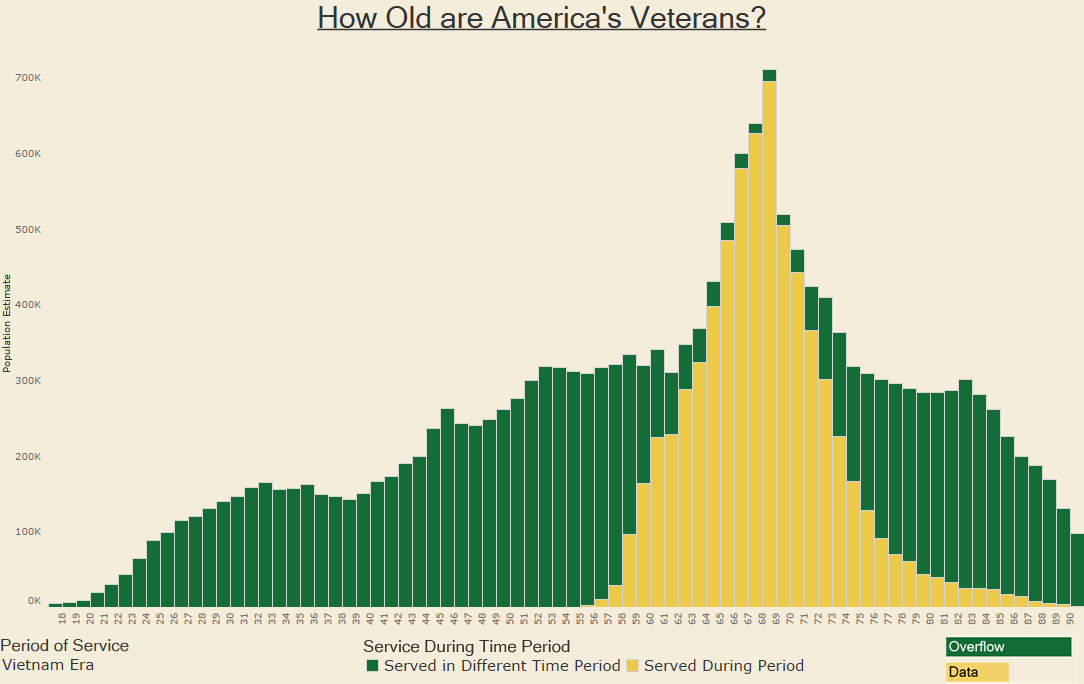 [/accordion]
[accordion title=”February 1955 – July 1964″ load=”hide”] 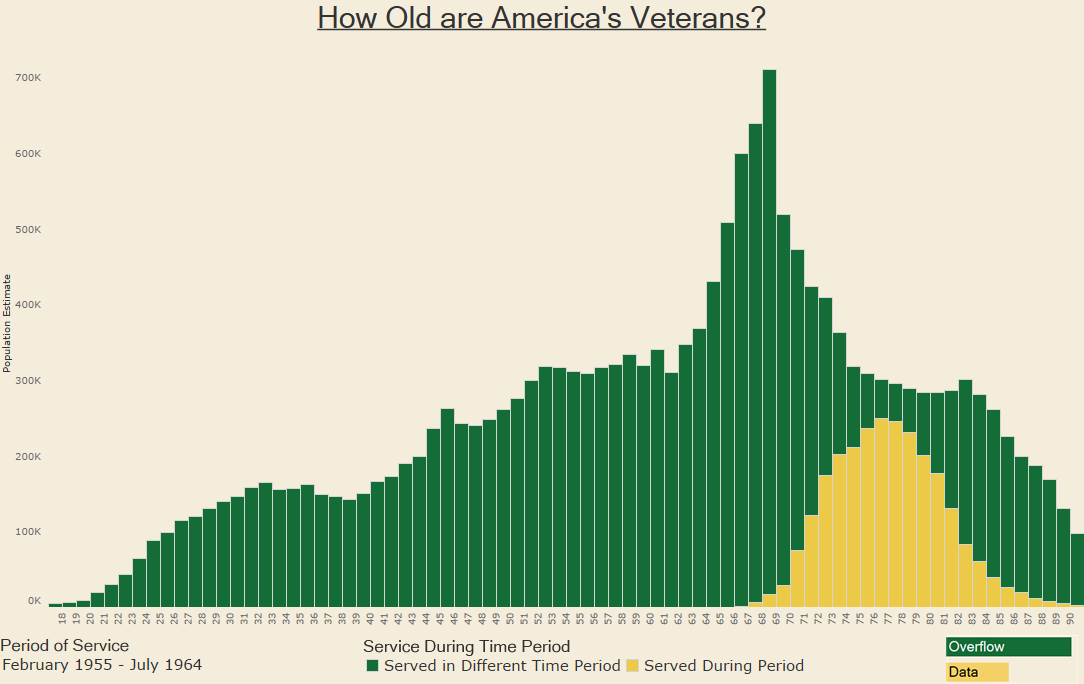 [/accordion]
[accordion title=”Korean War” load=”hide”]
 [/accordion]
[accordion title=”January 1947 – June 1950″ load=”hide”] [/accordion]
[accordion title=”World War II” load=”hide”]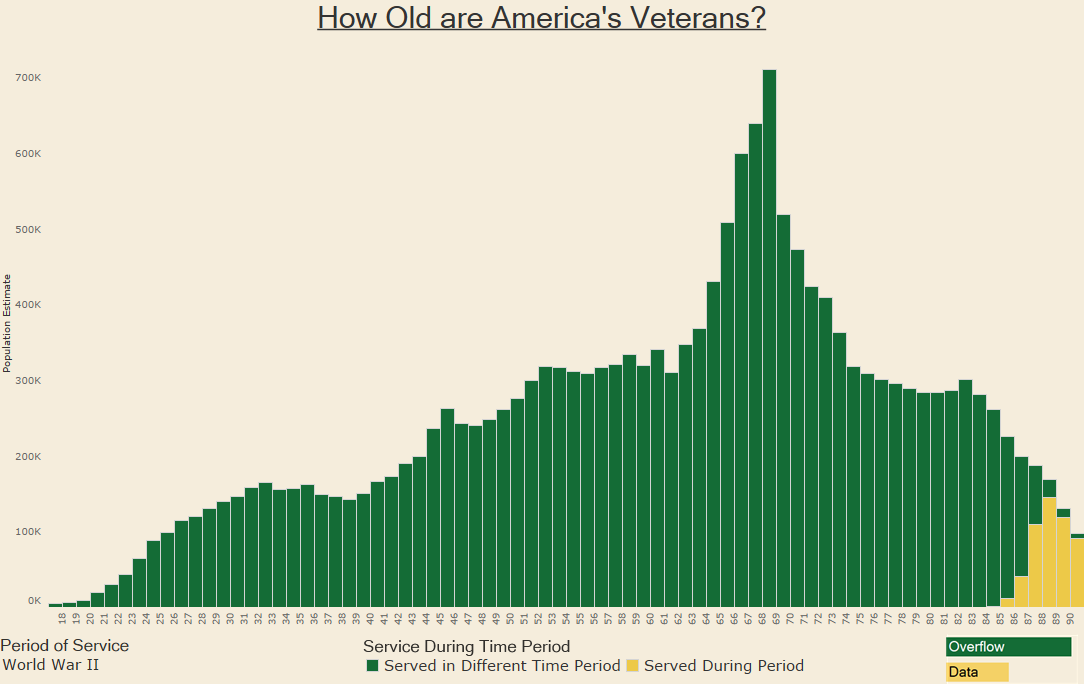
[/accordion]
[/accordions]
Data Notes
The data for this visualization comes from the American Community Survey which is completed by the US Census Bureau. I used the 2015 One Year Estimates Public Use Microdata Sample, which can be found on the ACS Website. This visualization uses Tableau to show the age of America’s veterans.
If you want to keep up with our surveys and data analysis, be sure to follow us on Twitter and Facebook.
How Old Are America’s Veterans? #dataviz #VeteransDay https://t.co/wciYqZ8mFG pic.twitter.com/pCcszk1vRh
— Overflow Data (@overflow_data) November 11, 2016
