Visualization
Data Notes
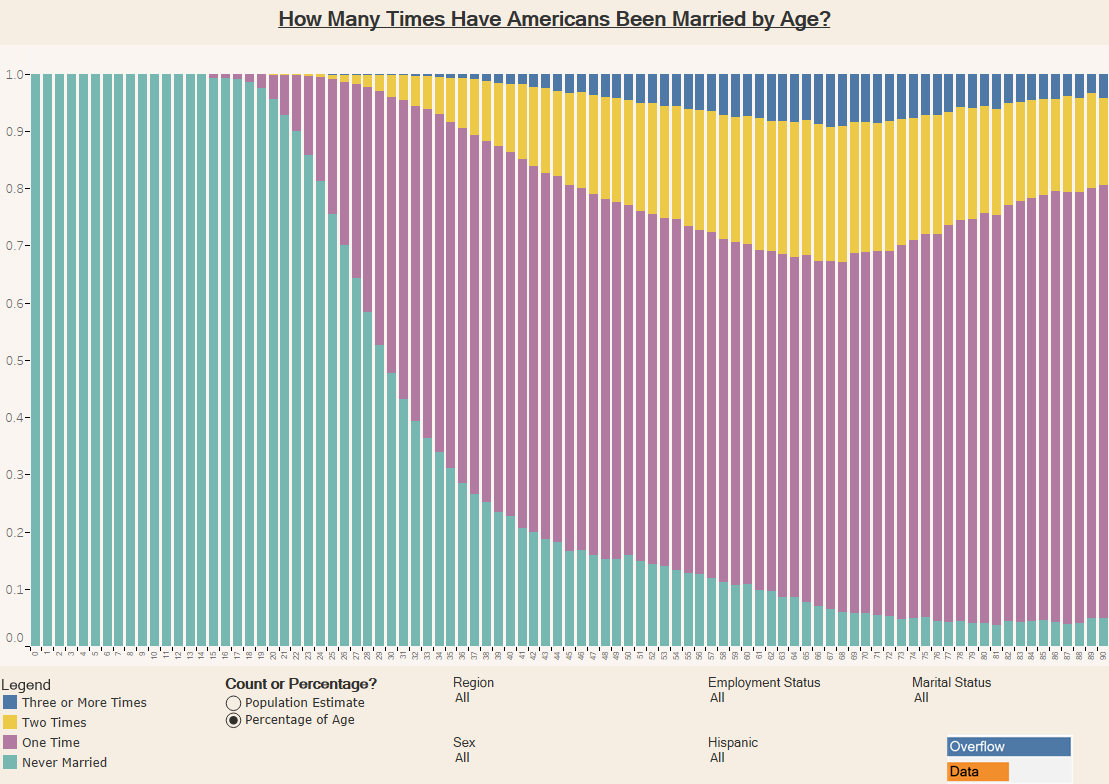
I was interested in seeing how many times people get married and remarried through out their life. The best way I could figure out to do this was to use data from the American Community Survey. This Census Bureau program collects data that can be used to look into how many times people of certain age group get married. I used the 2015 One Year Estimates Public Use Microdata Sample, which can be found on the ACS Website. I then used Tableau to visualize the data. If you are interested in more data like this be sure to check out my “How American’s Differ by Age” Data Visualization.
If you want to keep up with our surveys and data analysis, be sure to follow us on Twitter and Facebook.
How Many Times Have Americans Been Married by Age? #dataviz https://t.co/R5EOLRwznH pic.twitter.com/JelWJ8cuHb
— Overflow Data (@overflow_data) December 13, 2016


