Introduction
Last week, I looked at data showing what percentage of households have Internet access. I realized, I might of gotten a little ahead of myself, because I hadn’t looked at what percentage of households have computers. I was able to find the data from the same source, the American Community Survey, which is conducted by the US Census Bureau.
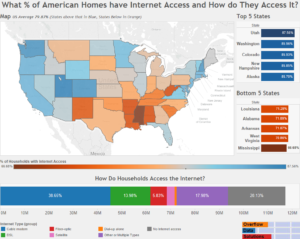
85.1% percent of American homes have some sort of computer. The visualization below shows the percentage of people that own some sort of computer in the counties that the data is available, the top 5 and bottom 5 states for computer ownership, and the breakdown of the types of computers households have. You are able to sort the data by geography using the filters on the bottom, or by selecting a county or state in the graphics.
Visualization
Data Notes
The data for this visualization comes from the United States Census Bureau. It is gathered during the American Community Survey. I used 2014, 1 Year Estimates for each of the states and counties.This can be found at American Fact Finder under Table B28001.
Since data is only released yearly for geographies with more than 65,000 people, I had to calculate the difference for the counties with less than 65,000 people.These totals can be found if you filter by county.
A complete list of the percentage of households with some sort of computers isn’t provided in this visualization, but if you are interested you can find it here.
If you want more information on what is considered a computer you can find more detailed information on the American Community Survey form. The computer question is on Page 5 and is Question 9
I utilized Excel, Access, and Tableau to create this visualization.
If you want to keep up with our surveys and data analysis, be sure to follow us on Twitter and Facebook.


