Introduction
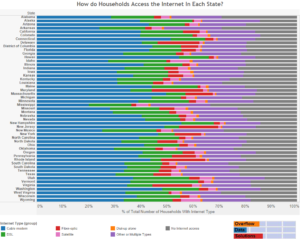
Access to a stable internet connection has almost become a necessity to American Life. I was curious to see what percentage of Americans have access to the internet in their homes. I was able to find that in 2014, the American Community Survey estimated that approximately 79.87% of households have internet access. This can vary though by state. The visualization below shows the percentage of people that have internet access in each state, and how they access the internet.
Visualization
Data Notes
The data for this visualization comes from the United States Census Bureau. It is gathered during the American Community Survey. I used 2014 1 Year Estimates for each of the states. This can be found at American Fact Finder under Table B28002.
I utilized Excel and Tableau to create this visualization.
The “Other and Multiple Types” Internet Access category includes all households that reported multiple types of “fixed internet access”, only had a mobile internet connection, and those that reported having some other type of internet connection.
If you want to keep up with our surveys and data analysis, be sure to follow us on Twitter and Facebook.
Up Next
How do Households Access the Internet In Each State?
Woah! I’m really enjoying the template/theme of this blog.
It’s simple, yet effective. A lot of times it’s difficult to get that
“perfect balance” between user friendliness and appearance.
I must say you’ve done a amazing job with this. In addition, the blog loads
super quick for me on Internet explorer. Superb Blog!
Really enjoyed this blog article. Will read on…
Lovely just what I was looking for.Thanks to the author for taking his clock time on this one.
Just wanted to mention keep up the excellent job!