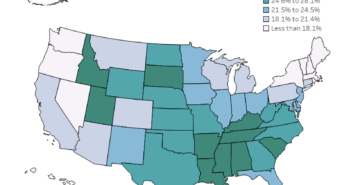
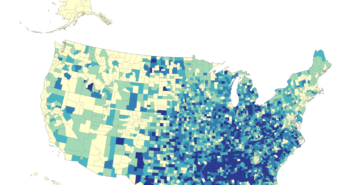
Data Notes
The data for this visualization comes from the United States Census Bureau. The square mileage of land comes from the American Community Survey. Table G001 from 2009 was used. This can be found at American Fact Finder. The population comes from Census’s 2015 Annual Population estimates which can be found at American Fact Finder as well.
After downloading the data Microsoft Excel, and Tableau were used to create this visualization. If you have any questions go ahead and leave me a comment.
If you want to keep up with our surveys and data analysis, be sure to follow us on Twitter and Facebook.


