Data Notes
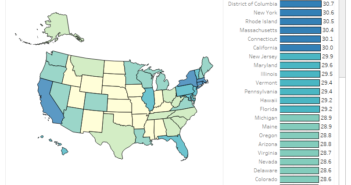
The data for this visualization comes from the American Community Survey which is completed by the US Census Bureau. I gathered the data from American Fact Finder from tables B01002A-B01002F for 2006-2014. I used excel to compile the data and Tableau to visualize it.
You can find more visualizations about the median age geographically or changes over time here.
How is Race and Ethnicity Defined by Census Bureau?
The Census Bureau has a number of different ways that they can categorize race, ethnicity, and different combinations of the two. This graphic attempts to employ their simplest methods of defining race and ethnicity.
All of the race categories shown are for one single race category alone. If anyone replies that the are two or more races, they are lumped together in that category. This graphic also looks at the ages of Hispanics and Latinos, which the Census Bureau defines as an ethnicity. Anyone can report one of the race categories and that they are Hispanic or Latino. Since a large number of Hispanic and Latino people report as White, there is a final category that shows White without Hispanic or Latinos included.
You can see images of the Hispanic Origin and Race Questions below.
[columns]
[column size=”1/2″]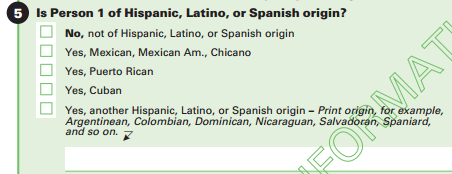 [/column]
[column size=”1/2″]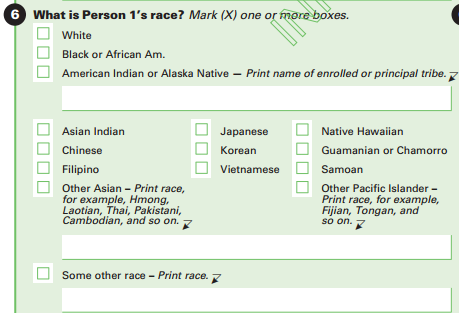 [/column]
[/columns]
If you want to keep up with our surveys and data analysis, be sure to follow us on Twitter and Facebook.
1 Comment
Wow, this article is fastidious, my sister is analyzing
these kinds of things, so I am going to convey her.