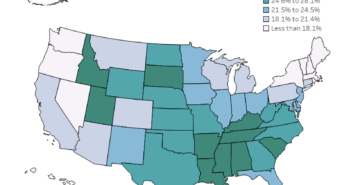
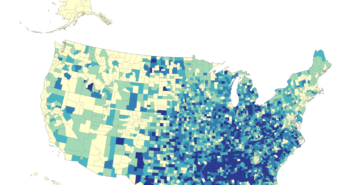
Be sure to alter the filters to see how this is different in each state and county.
Source
The data for this visualization comes from the American Community Survey which is conducted by the US Census Bureau. The 5 year estimates were used and are located on table S2101 at American Fact Finder. The data was then manipulated into a usable form in Excel. Finally, the data was presented in Tableau.


1 Comment
Thank you for sharing your info. I really appreciate your efforts and I am waiting for your next post thanks once again.|