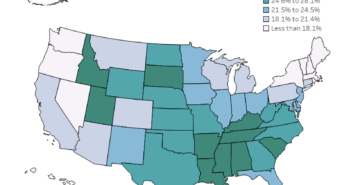
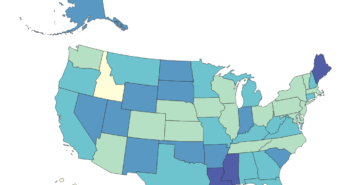
Visualization
If you are having issues with the interactive visualization, click here for a static image.
Data Notes
The data for this visualization comes from the American Community Survey which is conducted by the U.S. Census Bureau. I used the Census Bureau API to pull the 2015 1 year estimate so I could see the percentage of the population in each state that was born there. Once I had gathered the data, I used Tableau to create this visualization. If you would like to gather the same data, the web address I used is included below.
https://api.census.gov/data/2015/acs1/profile?get=NAME,DP02_0089PE&for=state:*&key=
If you want to keep up with our surveys and data analysis, be sure to follow us on Twitter and Facebook.
What percentage of each state's population was born in that state? #dataviz #tilemap https://t.co/6nJwHS5g1O pic.twitter.com/85cyPStgzr
— Overflow Data (@overflow_data) July 11, 2017


