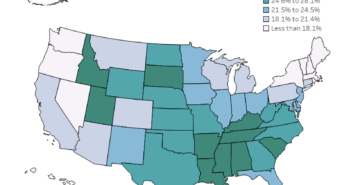
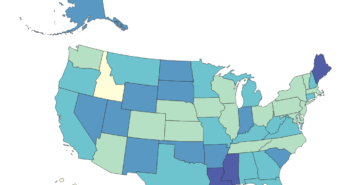
Visualization
If you are having issues with the interactive visualization, click here for a static image.
Data Notes
The data for this visualization comes from the Center for Disease Control. Once I gathered the data, I used Tableau to create this visualization.
If you want to keep up with our surveys and data analysis, be sure to follow us on Twitter and Facebook.
What Percentage of Adults are Obese in each State? #dataviz #TileMapTuesday #tilemap https://t.co/OAFdBSmBBt pic.twitter.com/LGvlDsl6DX
— Overflow Data (@overflow_data) August 15, 2017


