What States and Counties Have the Most Millennials? – Gallery
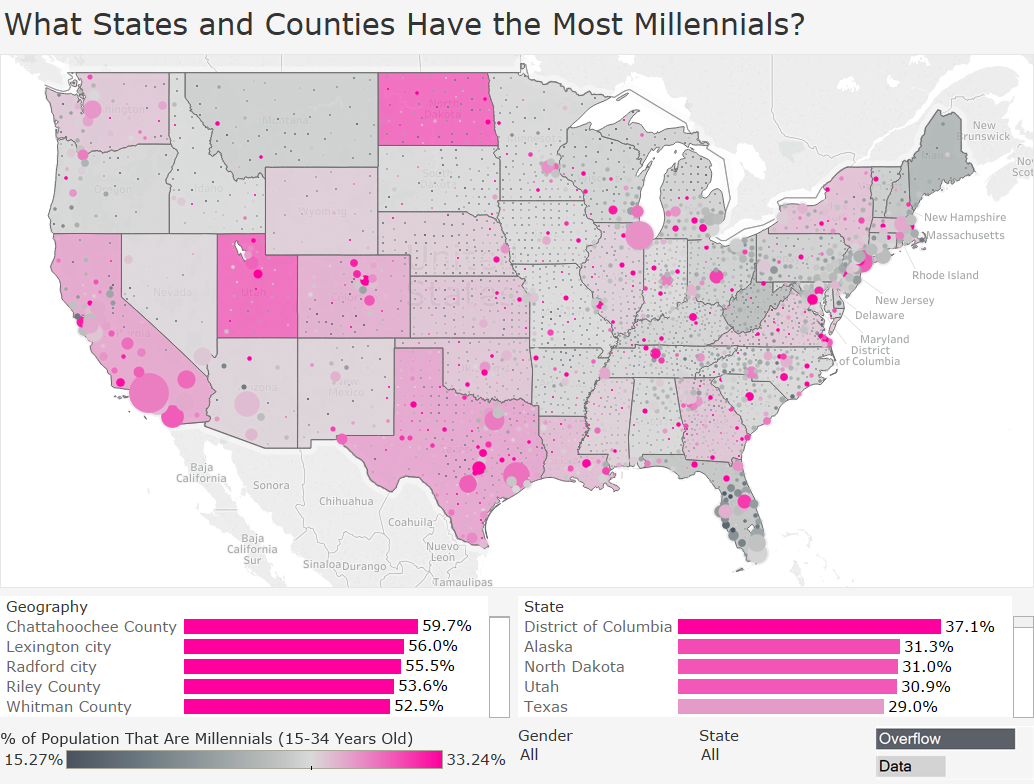
Almost 27% of Americans fall into the ages range that we defined as Millennials. This visualization lets you take a closer look by state and county.
Almost 27% of Americans fall into the ages range that we defined as Millennials. This visualization lets you take a closer look by state and county.
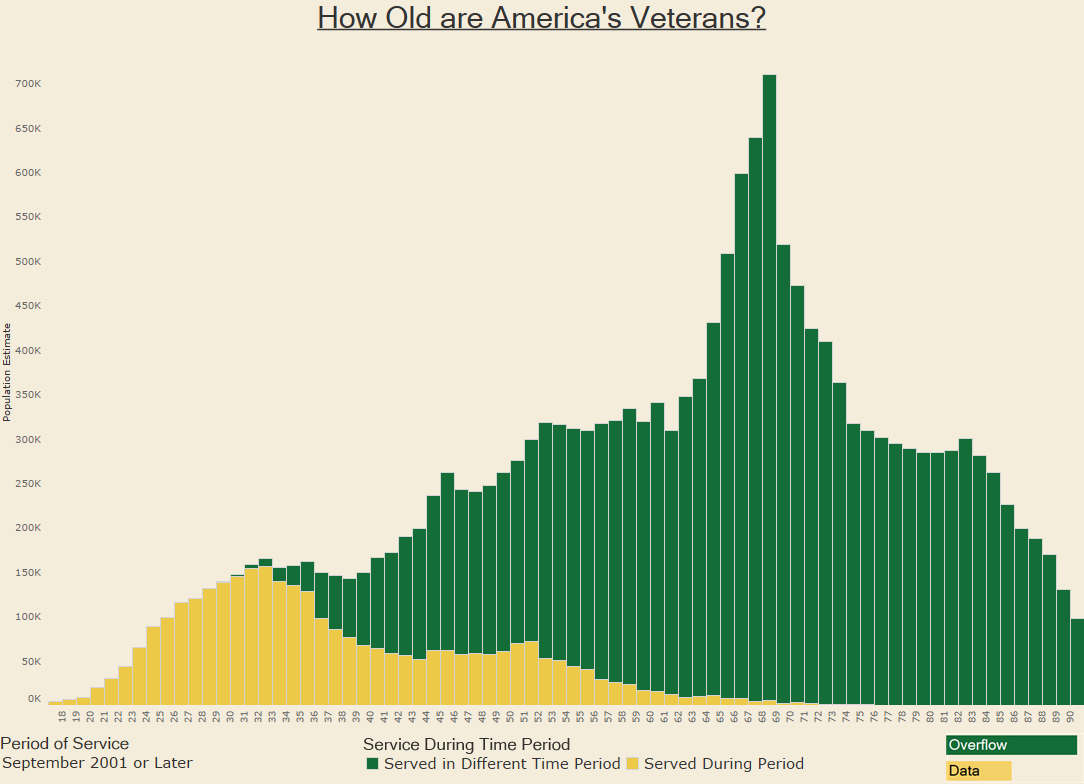
Introduction For Veterans Day, we decided to create a visualization recognizing our nations more than 18 million veterans. Using American Community Survey data we created […]
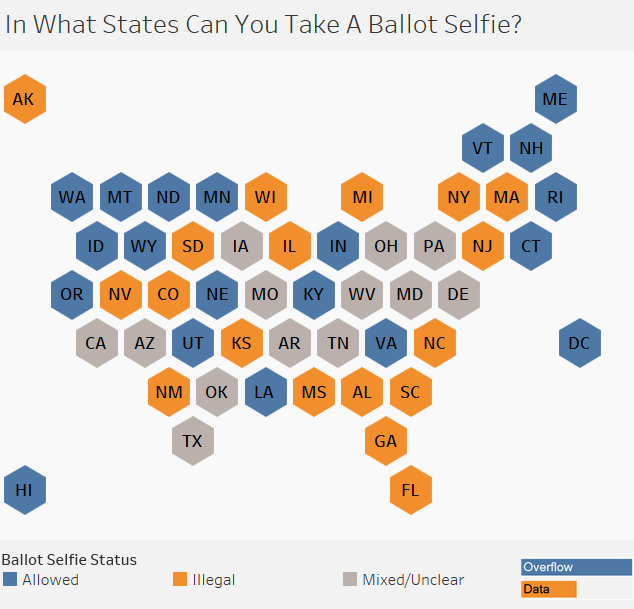
A look at whether or not you can take a picture with your ballot during the 2016 election.
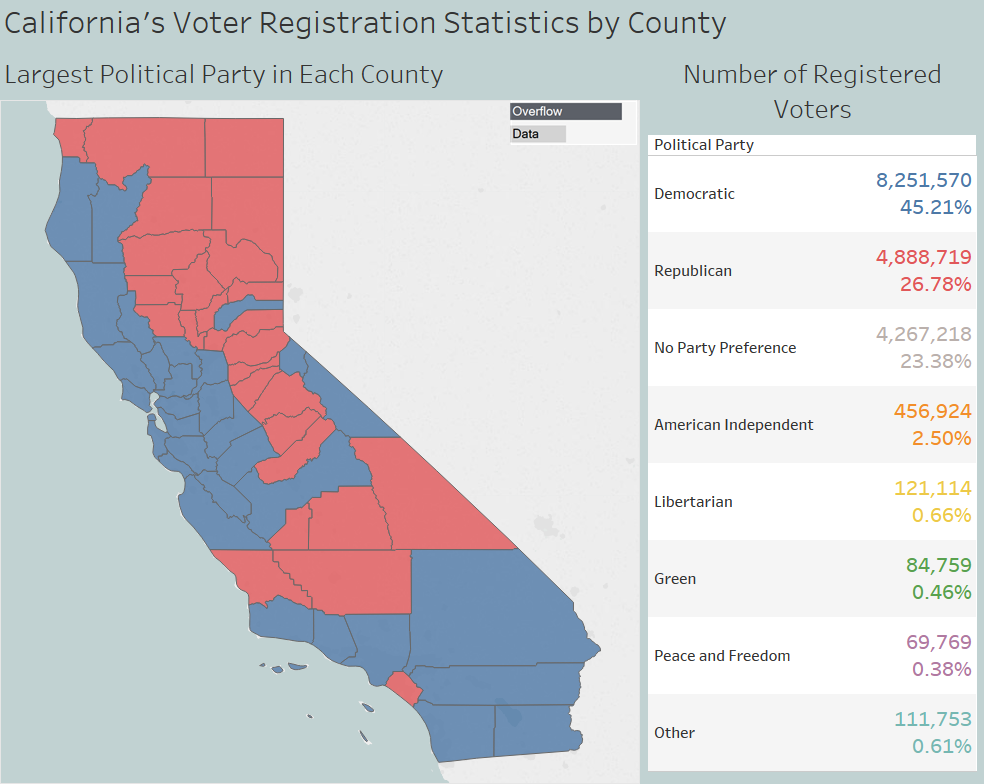
This data visualization used data provided by the California Secretary of State to show the political party preference of Californians by county.
Copyright © 2026 | WordPress Theme by MH Themes