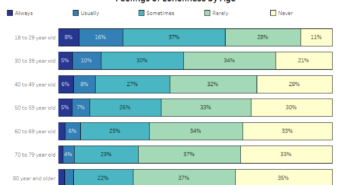
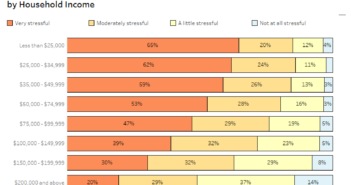
In 2017, 47,173 people lost their life to suicide in the United States. That means that for almost every 7,000 people in America, 1 of them committed suicide in 2017.
I have created this and other data visualizations in an attempt to bring attention to this issue and help to find clues about what we can do to help people considering suicide. This timeline, specifically shows the total number of people that has died each year from suicide since 1999. I have also included a toggle so you can see the suicide rate as well. From these trends, we can see that not only is the number of deaths increasing, but also the rate at which people commit suicide.
The suicide rate can differ for a number of different reasons though. There are higher or lower suicide rates for people based on their age and gender as well as marital and veteran’s status. Some of these traits may help to give us clues as to what we can do to help those that are distressed or in crisis.
If you or someone you know is considering suicide, please seek help. Anyone can reach out to the National Suicide Prevention Lifeline at 1-800-273-8255 or chat online.
Data Notes
The data for this visualization comes from the CDC WONDER online database. Specifically, I used detailed mortality data and isolated the cases of suicide. After I downloaded the data, it was cleaned in Tableau Prep Builder. I then used Tableau Desktop to create the timeline.


