Introduction
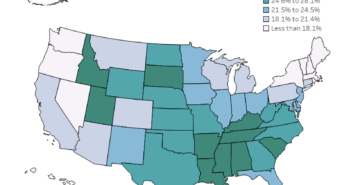
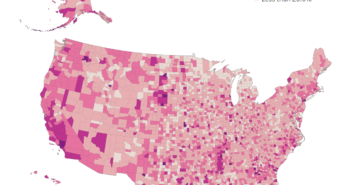
The median monthly housing costs in the US has risen from $845 in 2005 to $1009 in 2015, an increase of 19.4%. The visualization below, allows you to take an in depth look at the changes in household costs over that time.
Visualization
Mobile Users: If you are having issues using the interactive version of this visualization, you can find a static version of it here.
Data Notes
The data for this visualization comes from the American Community Survey which is completed by the US Census Bureau. The data tables where found at American Fact Finder and are found under Table B25105. The tables from 2005 to 2015 were used for each state and the national totals. Excel was used to compile the data and Tableau was used to create the visualization.
If you want to keep up with our surveys and data analysis, be sure to follow us on Twitter and Facebook.


