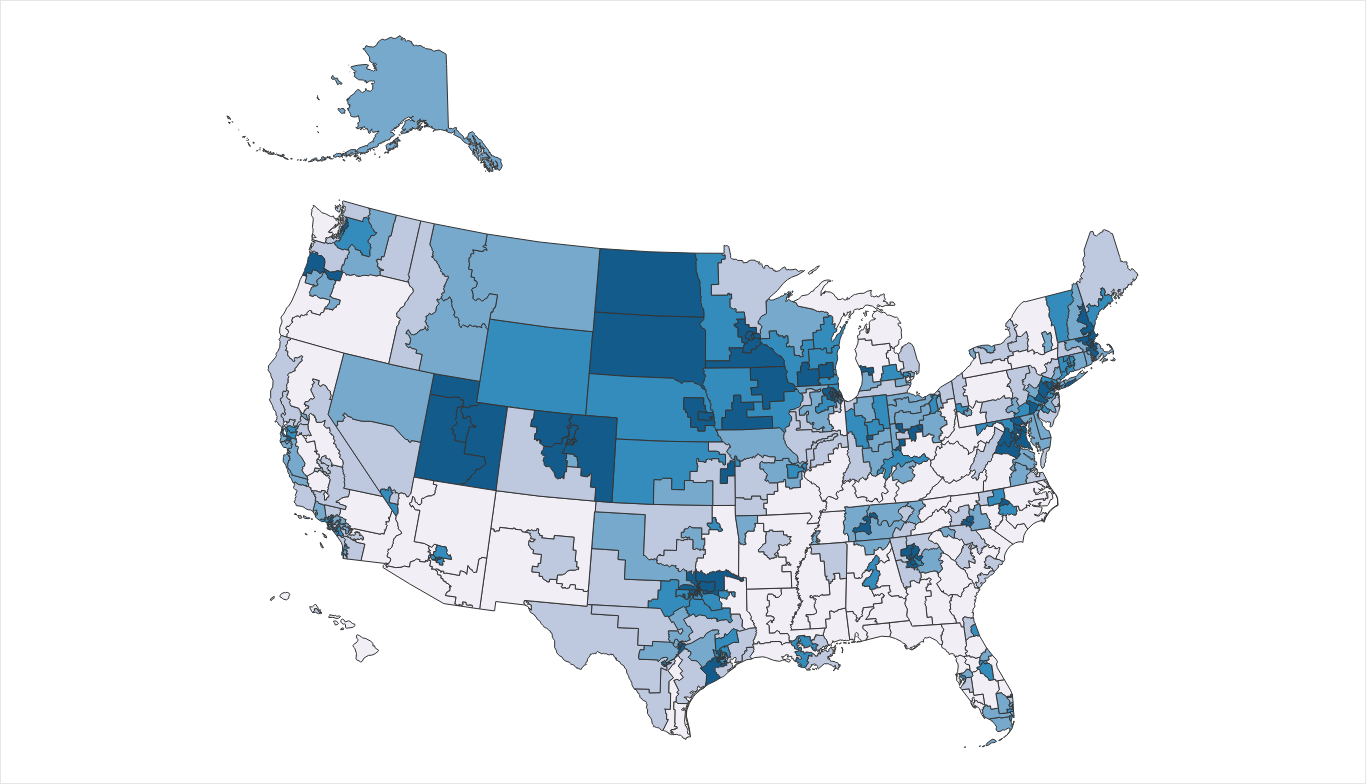
Congressional District Employment Status Explorer
Understand how employment is different in each congressional district by using this data visualization.
Understand how employment is different in each congressional district by using this data visualization.
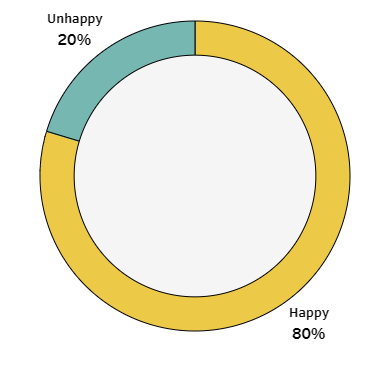
This data visualization answers the question of how many Americans are happy. It also explores how different traits are associated with happiness
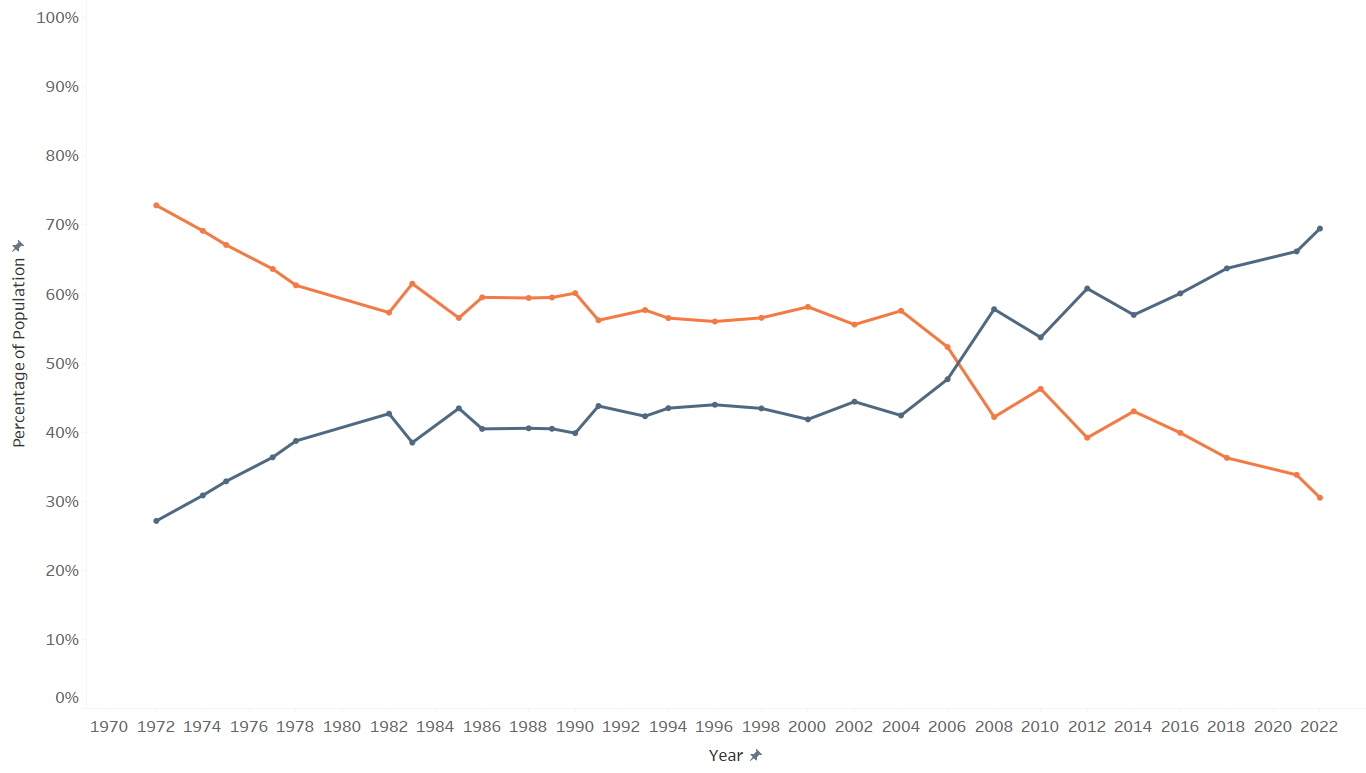
American opinions about premarital sex have seen a dramtic shift over the last few decades. See how much in this data visualization.

This data viz examines information to show different levels of educational attainment for people living in each district.
Copyright © 2026 | WordPress Theme by MH Themes