
What’s the Self-Reported Depression Rate by Age Group in the U.S.?
Exploring depression prevalence through Census data, this visualization unveils age-related reporting trends. The aim is to inform public health initiatives and promotes empathy.
Exploring depression prevalence through Census data, this visualization unveils age-related reporting trends. The aim is to inform public health initiatives and promotes empathy.
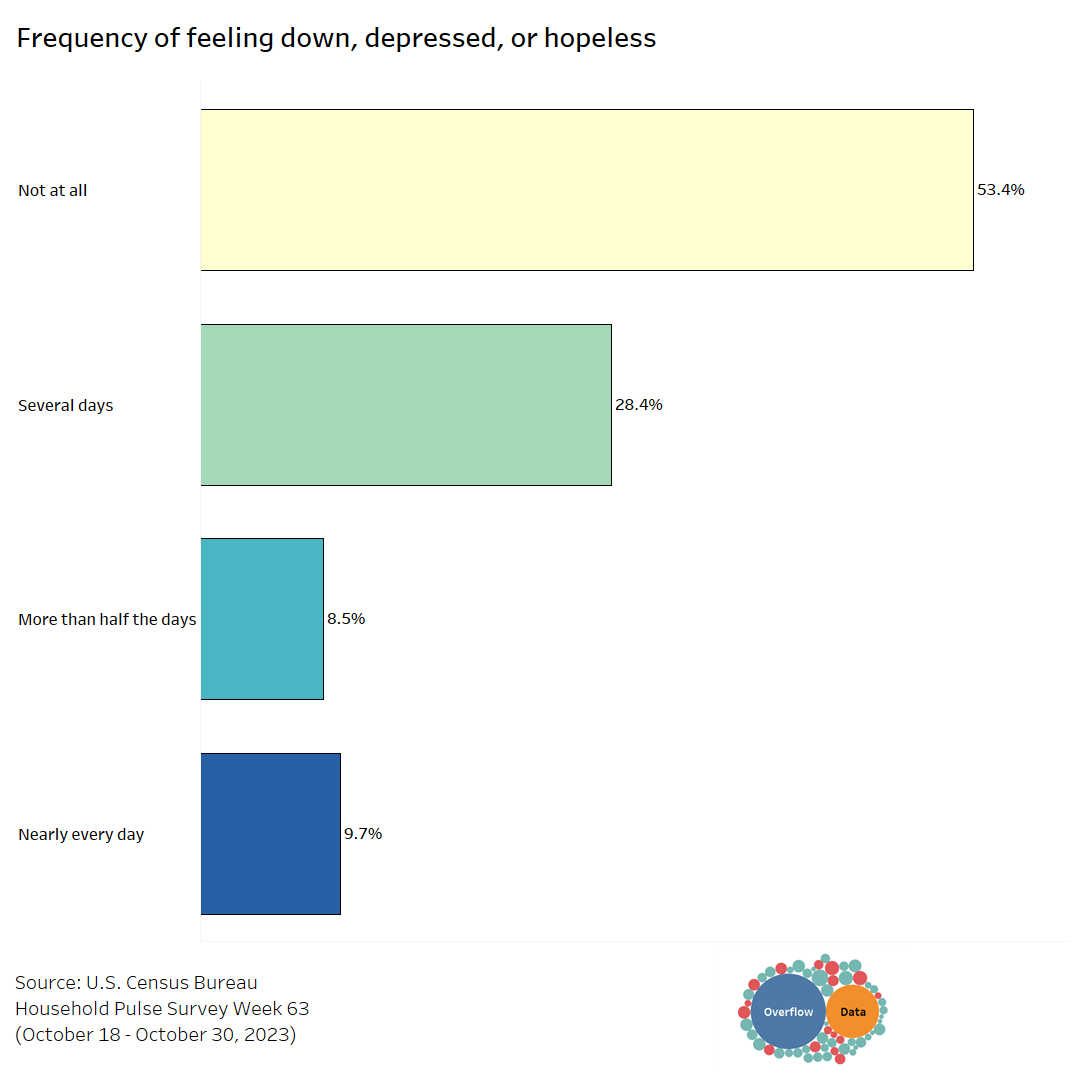
Explore the how many people have depression symptoms in the U.S. with insights from the Census Bureau data.
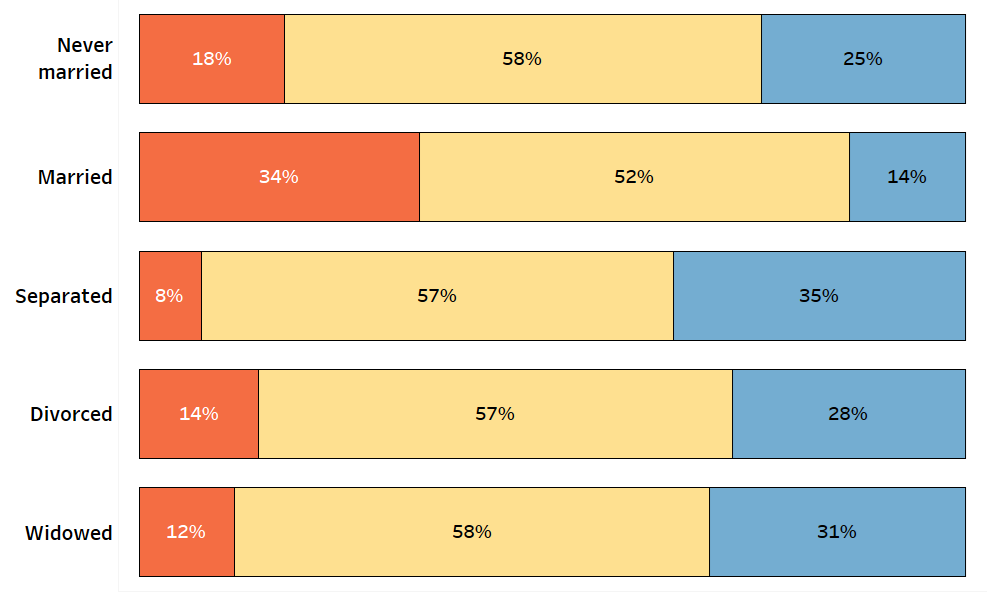
This article explores how marital status seems to be related to whether or not someone thinks they are happy.
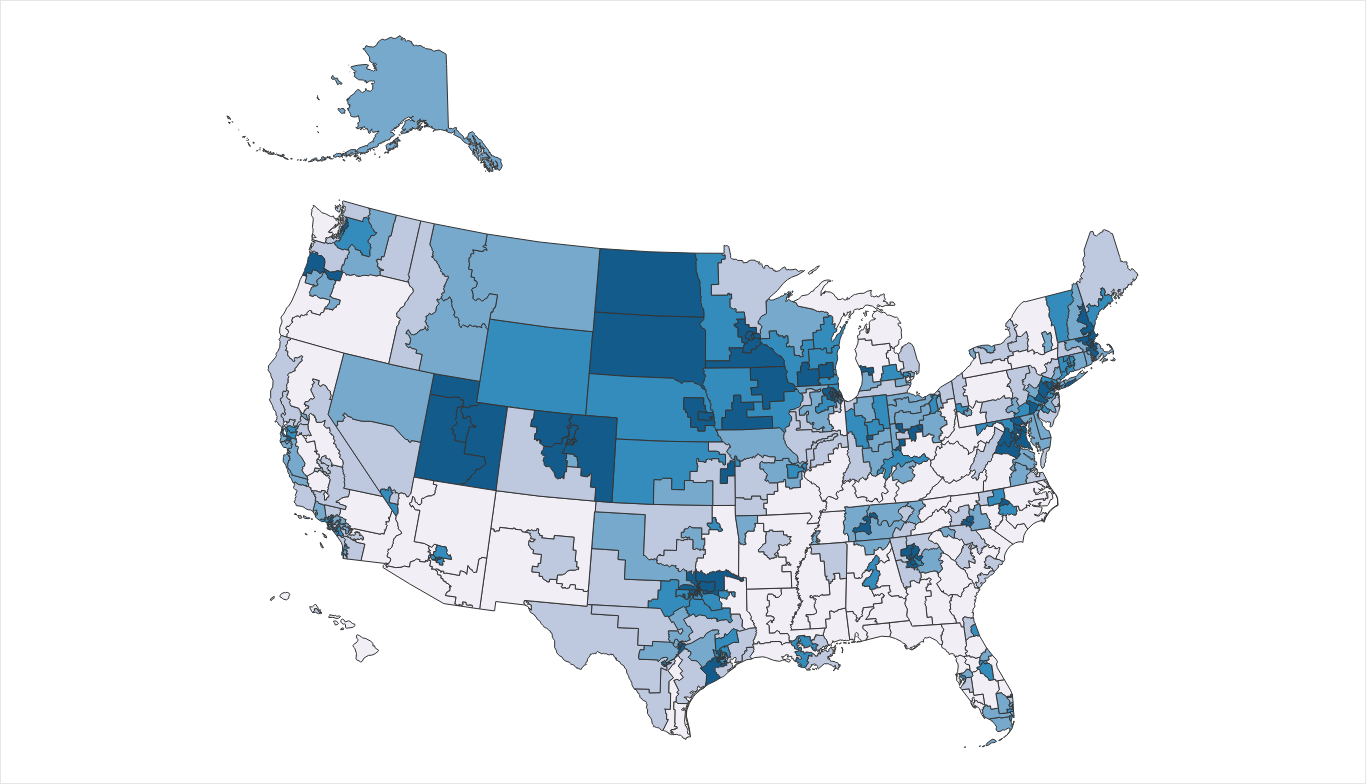
Understand how employment is different in each congressional district by using this data visualization.
Copyright © 2026 | WordPress Theme by MH Themes