
Which U.S. Counties Have the Oldest Populations?
Dive into our latest visualization mapping U.S. counties with the oldest populations. Uncover insights from the 2022 ACS 5-year estimates.
Dive into our latest visualization mapping U.S. counties with the oldest populations. Uncover insights from the 2022 ACS 5-year estimates.

Explore housing affordability trends effortlessly with our interactive visualization. Uncover key economic insights in U.S. counties. Dive into the data for a quick understanding of housing challenges.
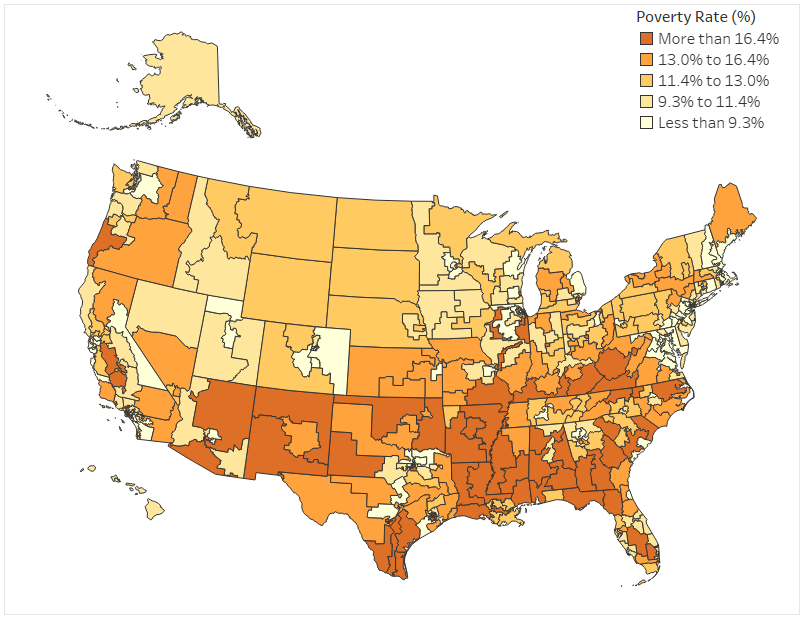
Explore the data on poverty in the each congressional district and discover which elected officials represent areas with the high poverty.

This data visualization allows you to explore various topics by different racial and ethnic groups in the United States and each state.
Copyright © 2026 | WordPress Theme by MH Themes