About the Data
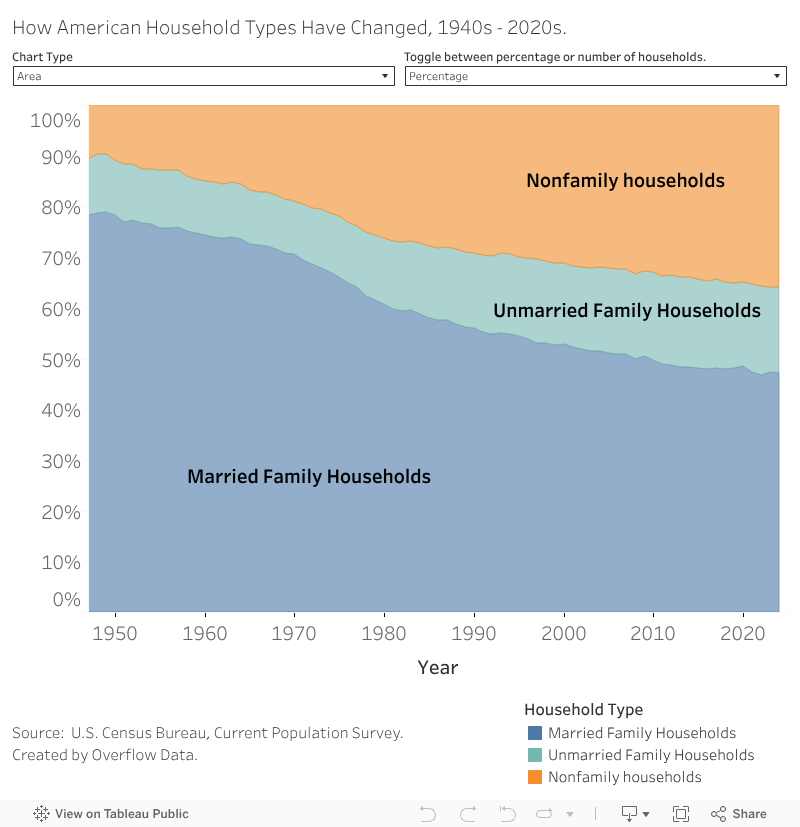
This visualization uses data from the U.S. Census Bureau’s Current Population Survey (CPS), which track how American households are structured over time. The estimates represent the total number and share of households classified as married family, unmarried family, or nonfamily households from the 1940s through the 2020s.
How It Was Created
The chart was built using publicly available CPS data. Interactive features allow users to view either the number of households or their share of all U.S. households, helping to highlight long-term social and demographic shifts.
Connection to QWIC
These patterns are closely linked to the Quality Wellness Indicator for Children (QWIC) framework. Household structure affects key dimensions of well-being for children, such as economic security, social connection, and child development. Tracking how family and nonfamily living arrangements evolve helps inform the QWIC measure.