Visualization
Data Notes
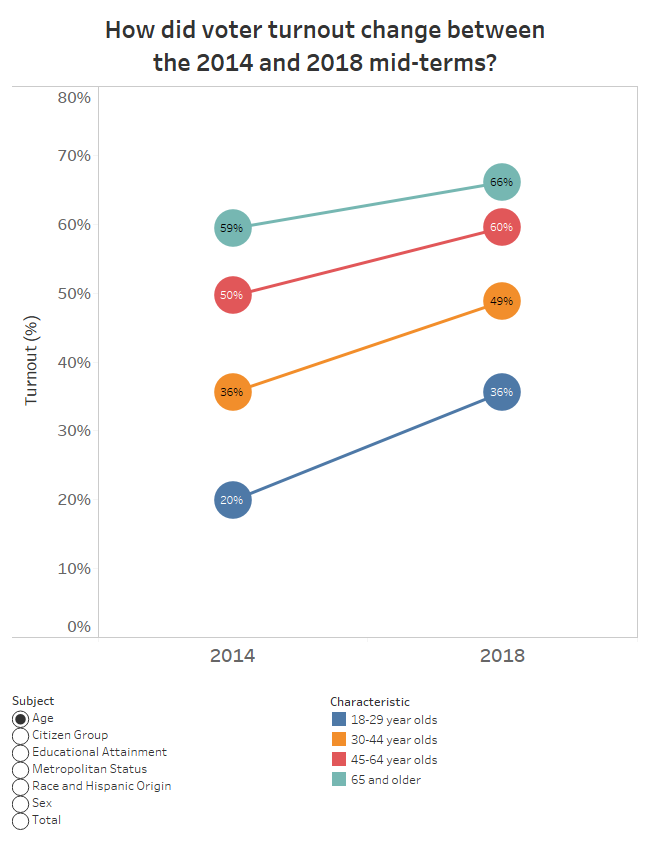
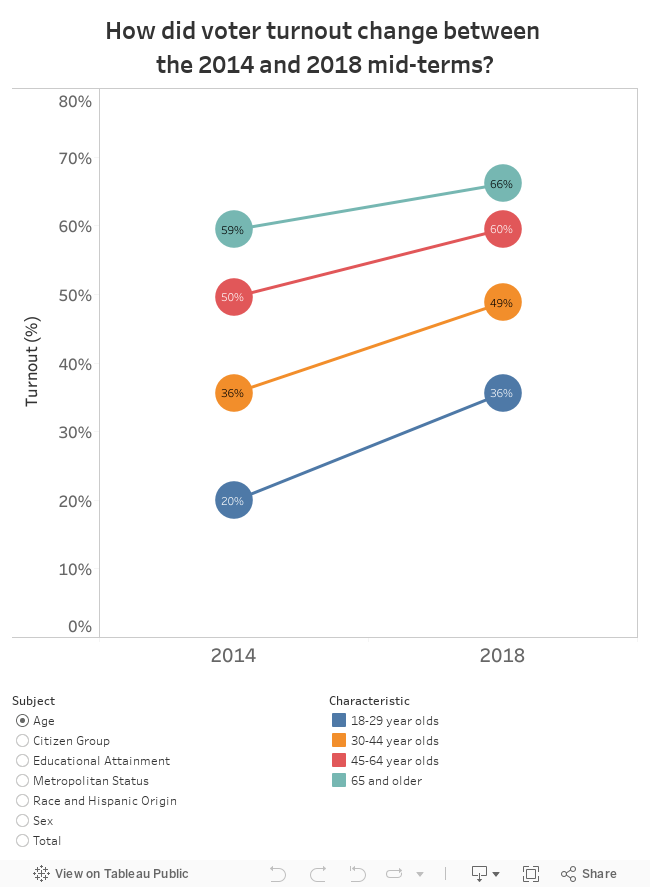
The U.S. Census Bureau recently released estimates showing how voter turnout changed between the 2014 and 2018 mid-term elections. This Tableau visualization allows you to explore how voter turnout changed and differed for different demographic groups.
If you want to keep up with our surveys and data analysis, be sure to follow us on Twitter and Facebook.
How did voter turnout change between the 2014 and 2018 mid-terms? #dataviz https://t.co/1O7QYRGs1G pic.twitter.com/a6IGPrHqHT
— Overflow Data (@overflow_data) May 17, 2019
Leave a Reply