
Visualization
Data Notes
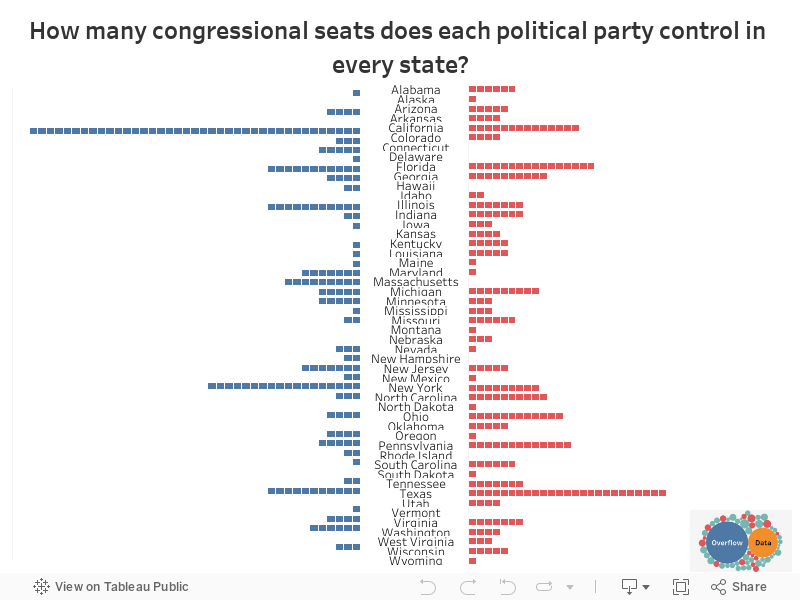
I wanted to make a graphic that better showed the number of congress members from each state than what you get when you look at a national map. This visualization lets you see the number without bias for geographic size. You can also scroll over the point to learn more about the districts and see a map of where the district is. The data for this visualization comes from the Wikipedia page for the 115th Congress. I used Tableau to create this visualization.
If you want to keep up with our surveys and data analysis, be sure to follow us on Twitter and Facebook.
How many congressional seats does each political party control in every state? #dataviz https://t.co/bbtKCyYoab pic.twitter.com/3Fc9ByvQWJ
— Overflow Data (@overflow_data) January 31, 2018
Leave a Reply