Which U.S. Counties Have the Longest Commutes?
Commute times can differ throughout the nation for many reasons. This data visualizations shows the places with the longest commute times.

Commute times can differ throughout the nation for many reasons. This data visualizations shows the places with the longest commute times.

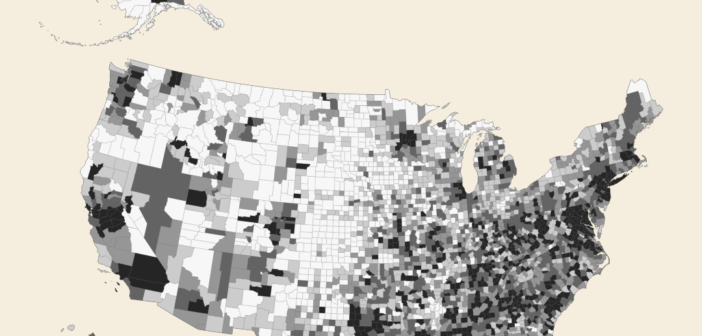
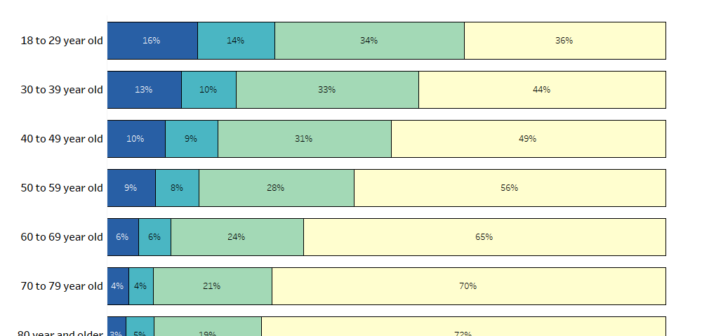
Exploring depression prevalence through Census data, this visualization unveils age-related reporting trends. The aim is to inform public health initiatives and promotes empathy.

Explore data on uninsured populations across the US. Informing policy decisions for impactful intervention strategies.

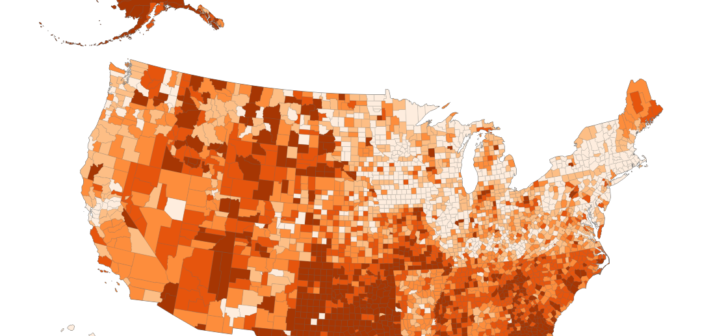
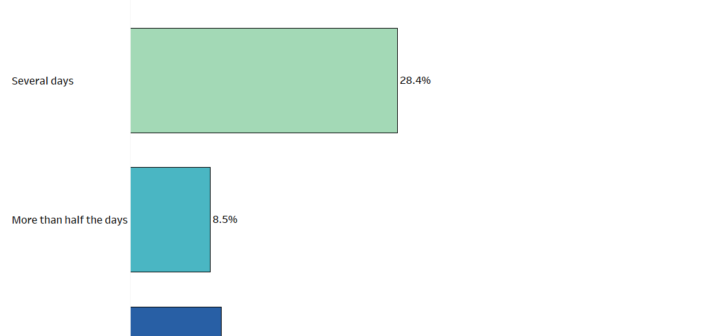
Explore the how many people have depression symptoms in the U.S. with insights from the Census Bureau data.