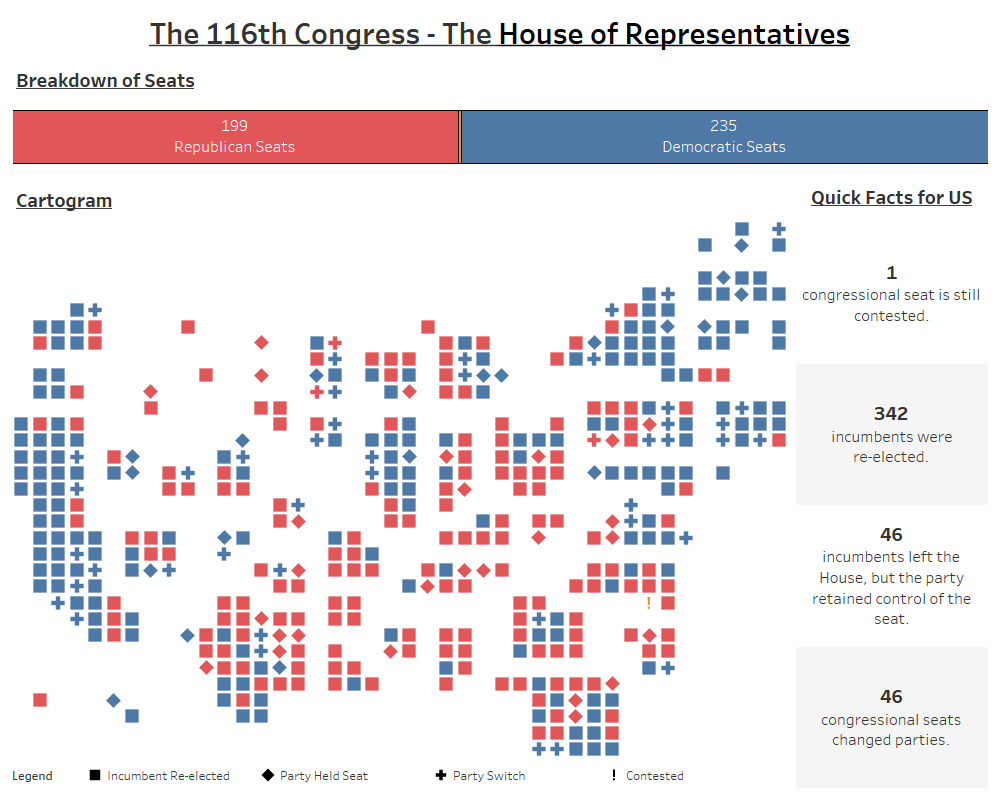
How Did the 2018 Midterms Change the House of Representatives?
The 2018 midterms drastically changed the party breakdown of the House of Representatives. Use this visualization to discover the current state of the House.
The 2018 midterms drastically changed the party breakdown of the House of Representatives. Use this visualization to discover the current state of the House.
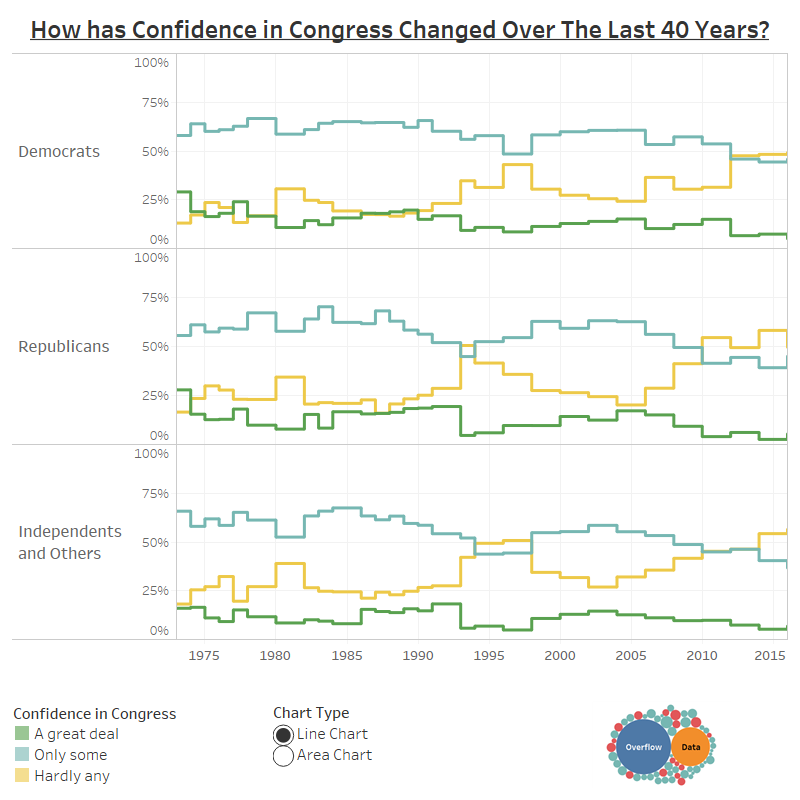
A look at how confidence in Congress has changed over time in the United States.
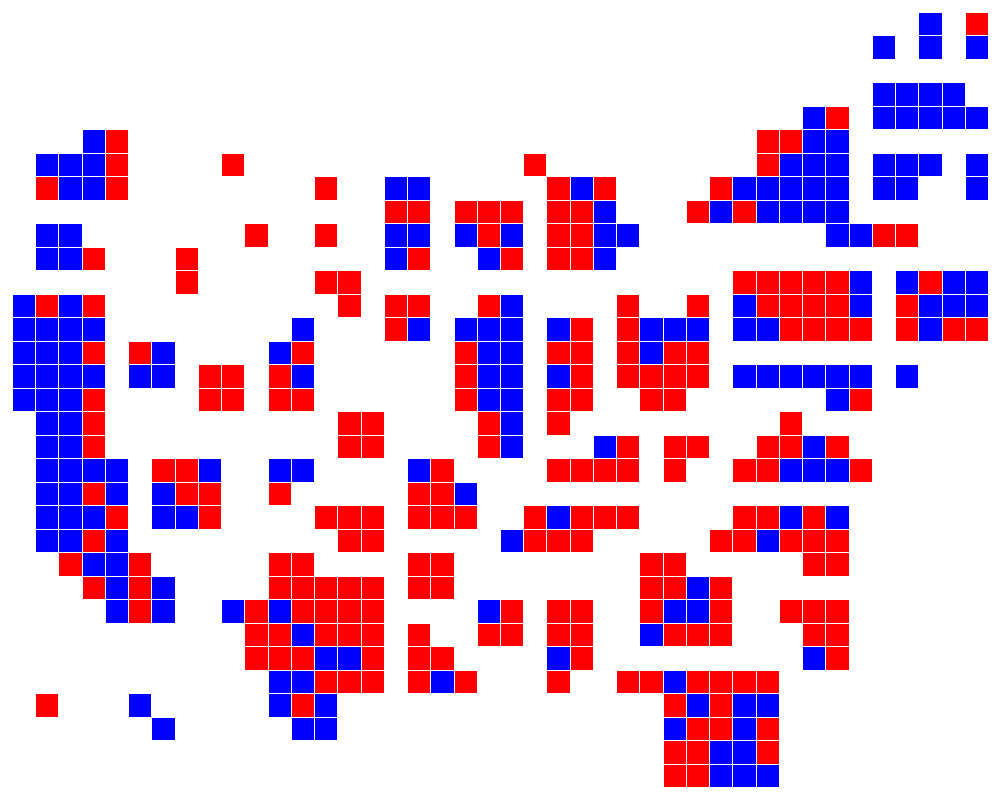
This post provides a Tableau cartogram of congressional districts. Feel free to use and share.
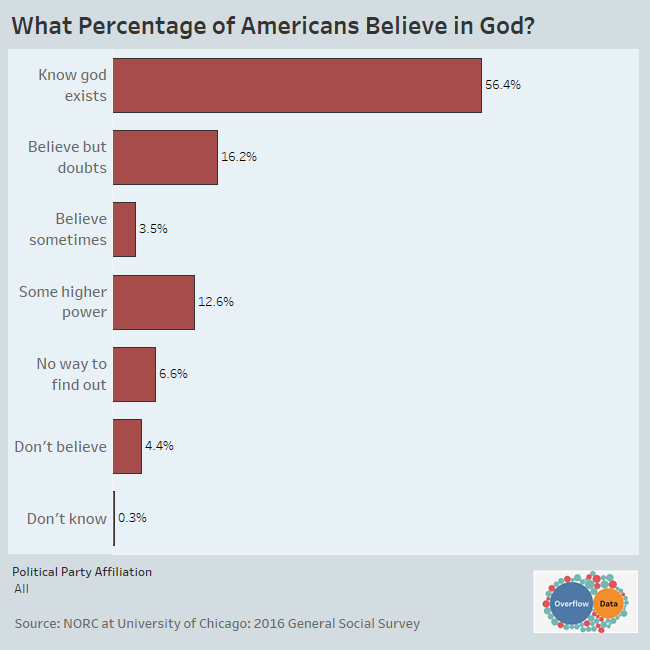
A look at how many Americans believe in God and how those views can vary by political party preference.
Copyright © 2026 | WordPress Theme by MH Themes