How Much Have Housing Costs Increased Since 2005? – Gallery
A quick look at the changes and trends in the total amount of housing costs in America.
A quick look at the changes and trends in the total amount of housing costs in America.
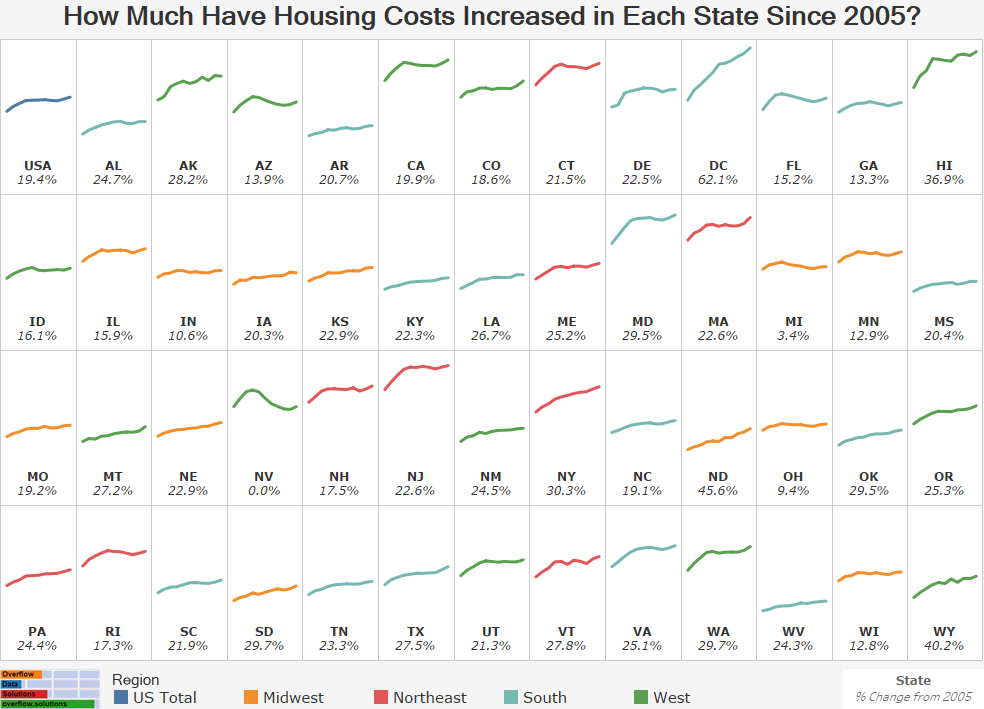
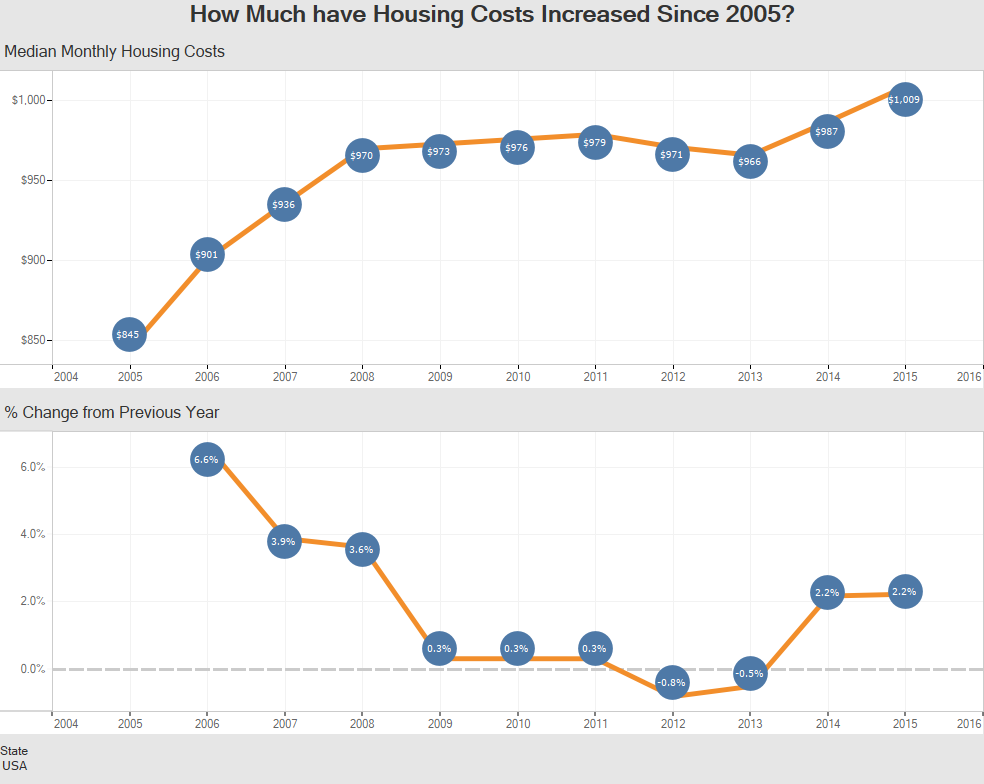
Housing costs have risen 19.4% since 2005 nationwide. Like most trends though, the data is different in every state. This visualization lets you see all the state trends in one spot.

Data Notes The data for this visualization comes from the American Community Survey which is completed by the US Census Bureau. The data tables where […]
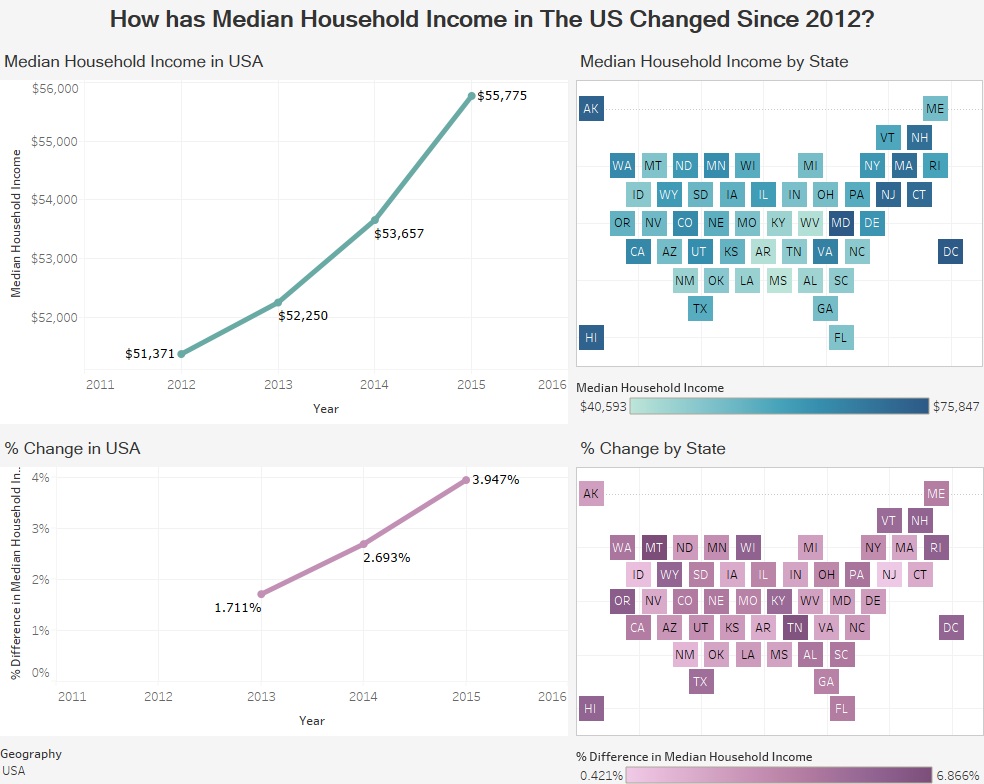
A quick look at how income is changing by state in the US.
Copyright © 2026 | WordPress Theme by MH Themes