The Evolving Shape of the American Household
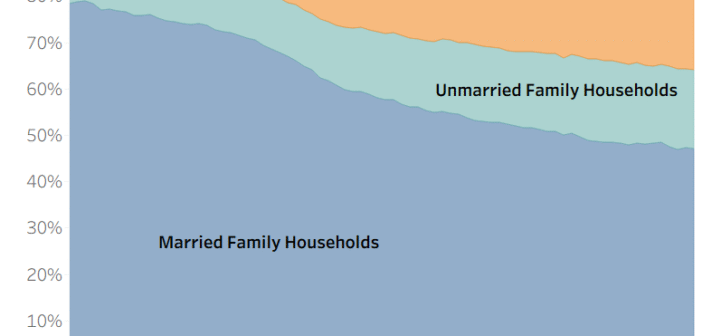
Explore how American household types have shifted since the 1940s using data. See trends in married, unmarried, and nonfamily households.

Explore how American household types have shifted since the 1940s using data. See trends in married, unmarried, and nonfamily households.

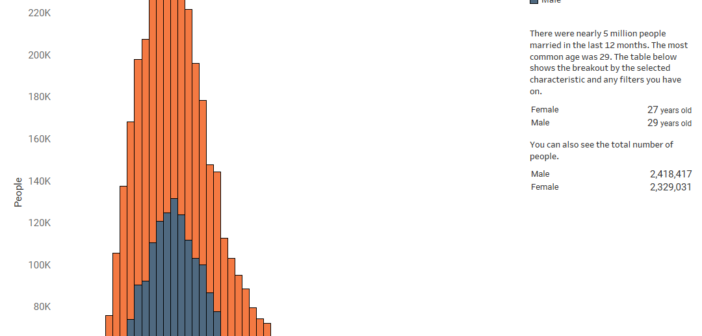
Nearly 5 million people got married in 2022. This data visualization looks at how old each of those people are.

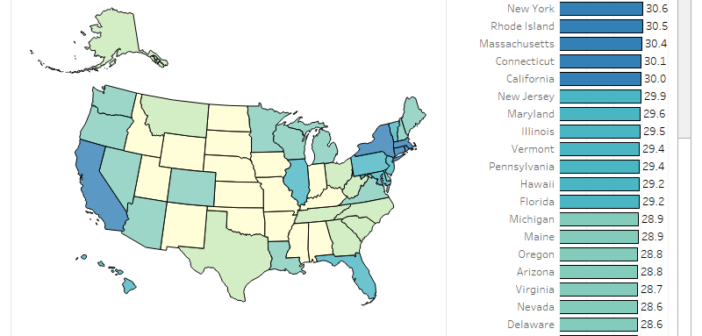
Each state has its own culture and traits. This visualization explores how there are differences in the age people get married in each state.

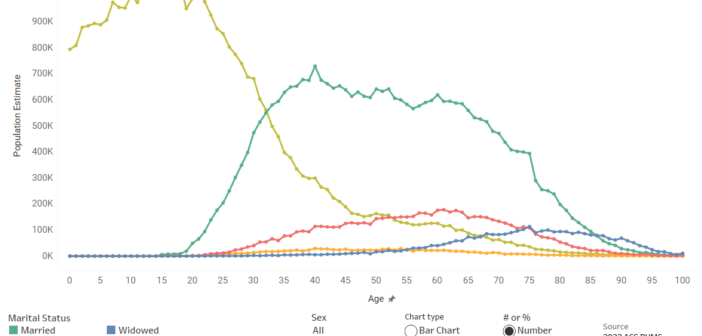
Changes in marital status certianly isn’t caused by age, but it does appear to be related. This visualization explores that relationship.