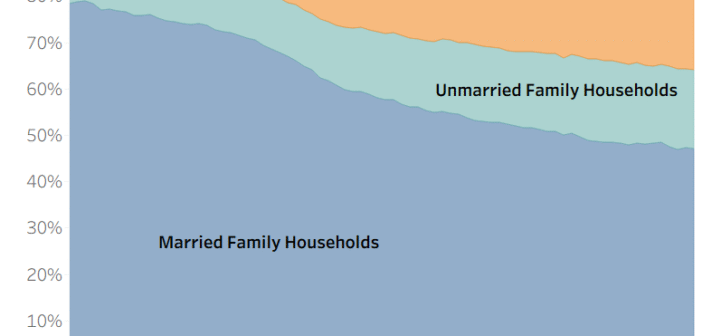
The Evolving Shape of the American Household
Explore how American household types have shifted since the 1940s using data. See trends in married, unmarried, and nonfamily households.

Explore how American household types have shifted since the 1940s using data. See trends in married, unmarried, and nonfamily households.

QWIC measures six protective factors of child well-being to track opportunity and the pursuit of happiness.

New Census data shows a striking divide in poverty rates across congressional districts and who represents them. Topping the list: New York’s 15th Congressional District, where 30.1% of residents are living in poverty. That’s nearly…

Learn from our data visualization how income and inequality varies across the 3,143 counties in the United States.