What Percentage of Household Income is Spent on Rent in Each State?
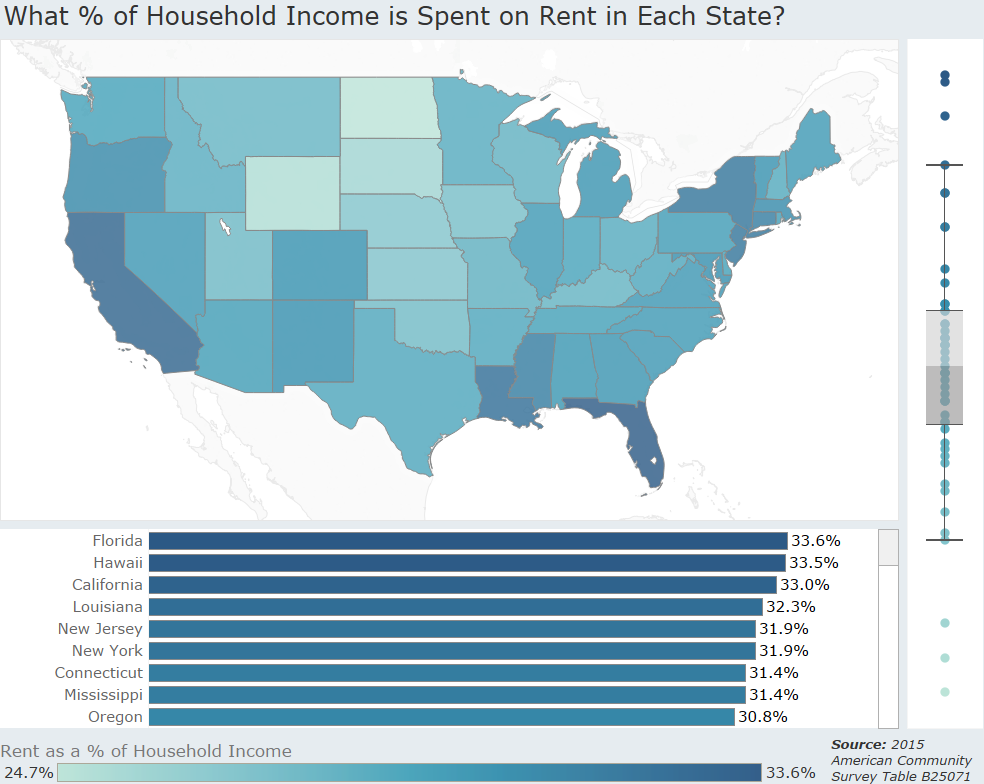
Renters in the US spend on average 30.3% of their household income on rent. Since this can differ by state we created this visualization to show the percentage by state.
Renters in the US spend on average 30.3% of their household income on rent. Since this can differ by state we created this visualization to show the percentage by state.
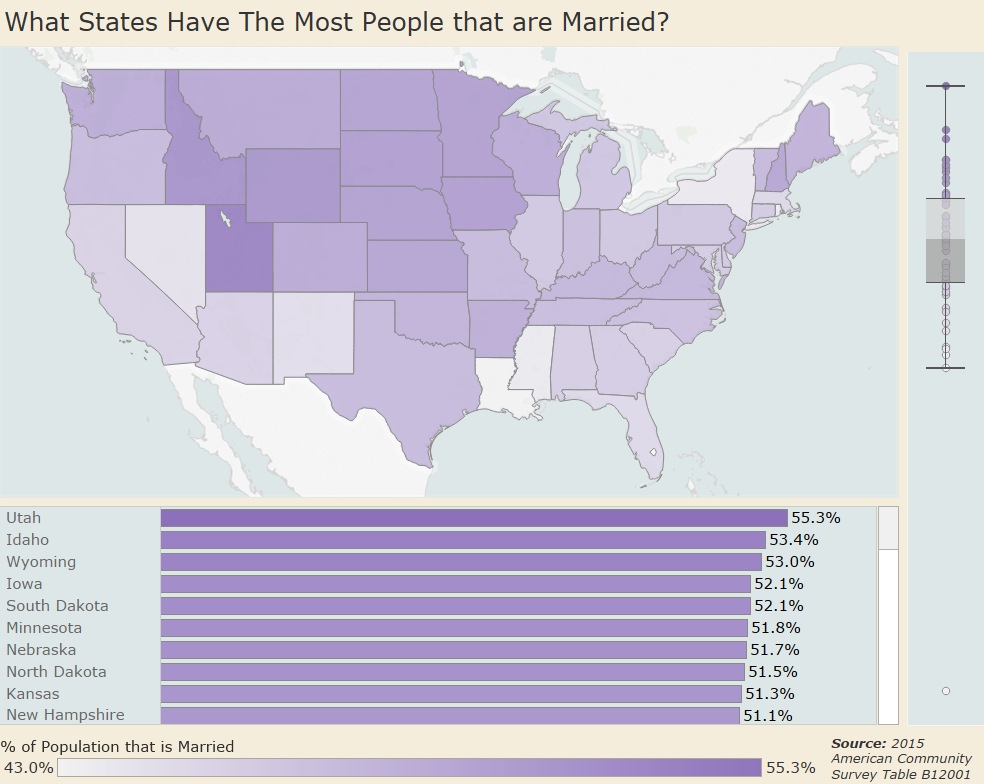
According to the Census Bureau, 47.5% of Americans are married. The visualization how this differs by state.
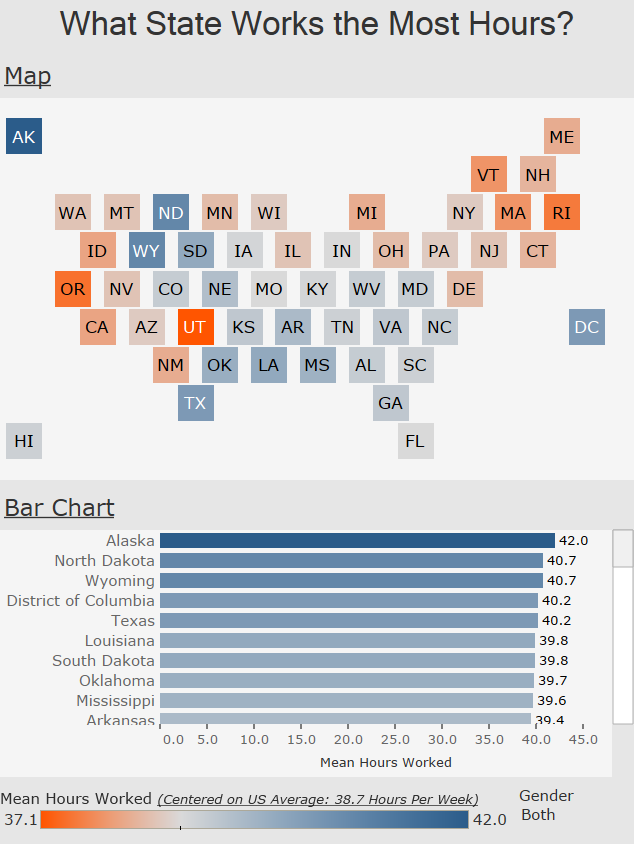
The average American worker spent 38.7 hours per week at work. Here is a look at how it differs by state.
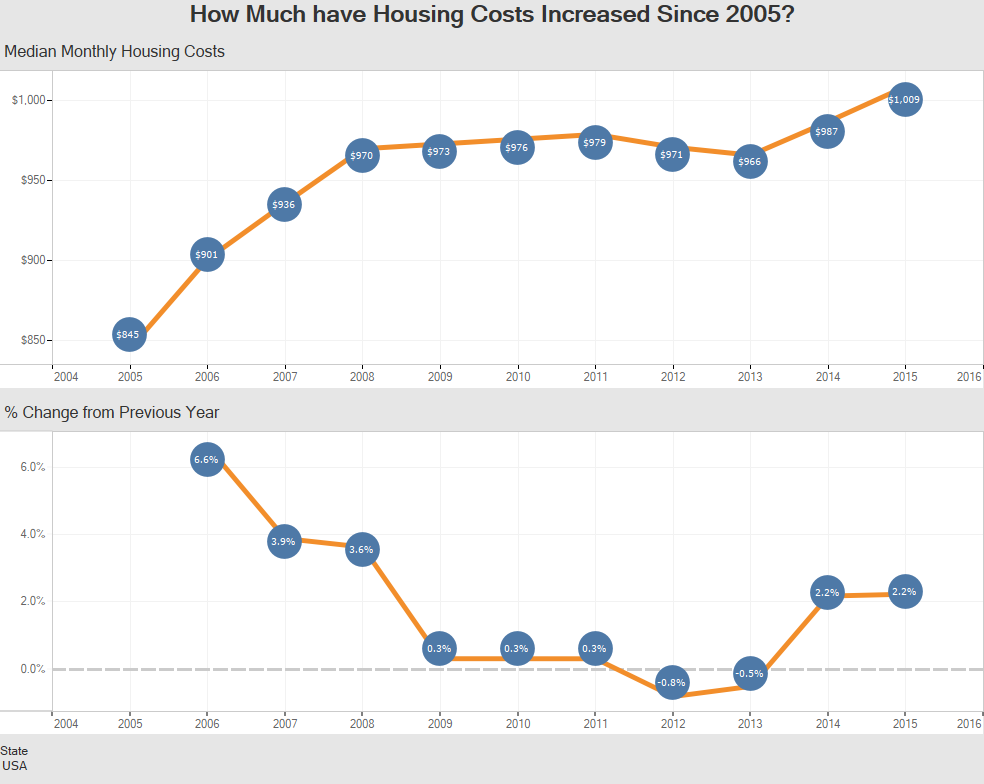
A quick look at the changes and trends in the total amount of housing costs in America.
Copyright © 2026 | WordPress Theme by MH Themes