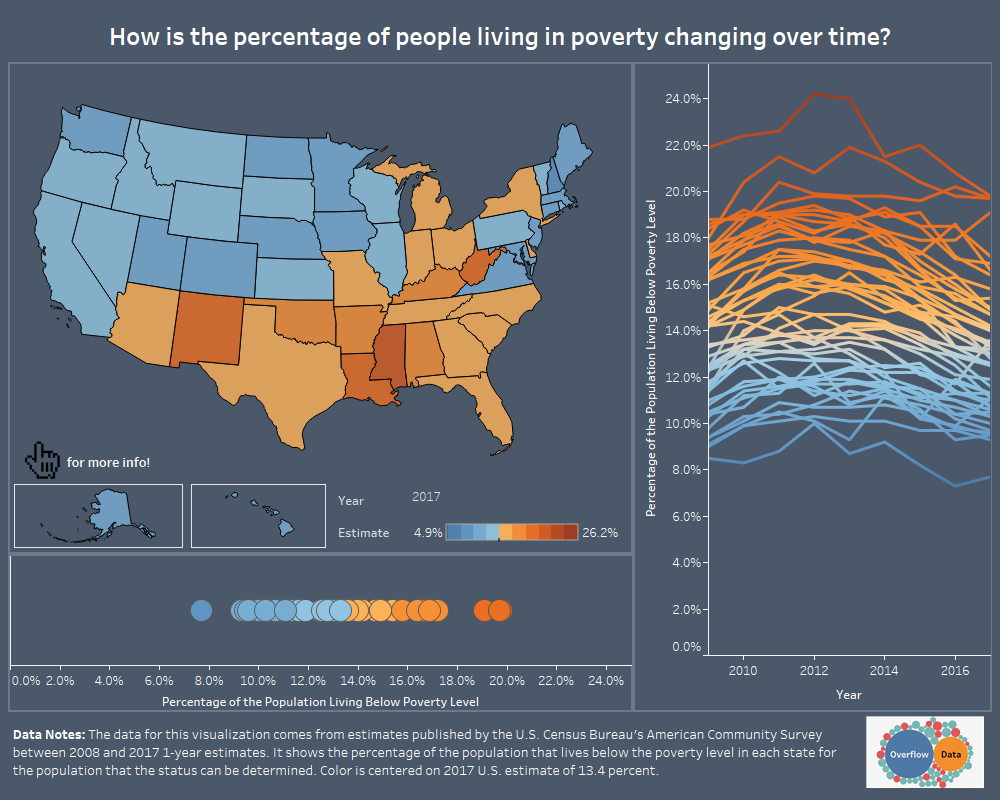
How is the percentage of people living in poverty changing over time?
A look at how the number of people in the U.S. living in poverty has changed over the last 10 year.
A look at how the number of people in the U.S. living in poverty has changed over the last 10 year.
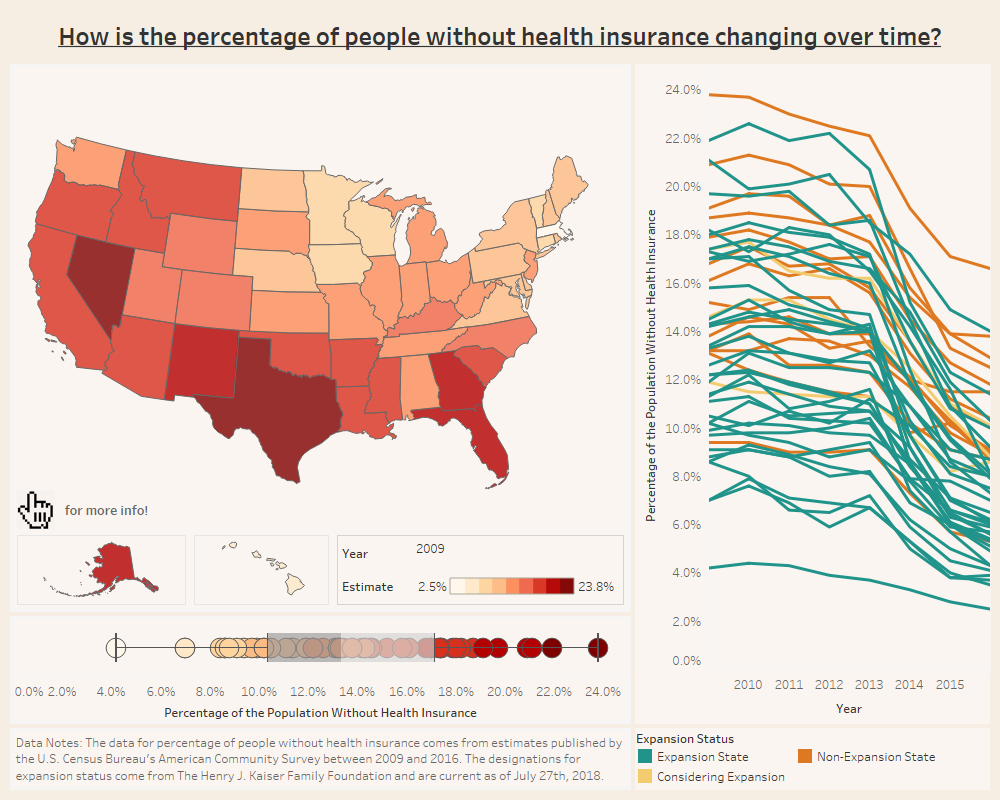
A look at how the percentage of people without health insurance in the United States is changing.
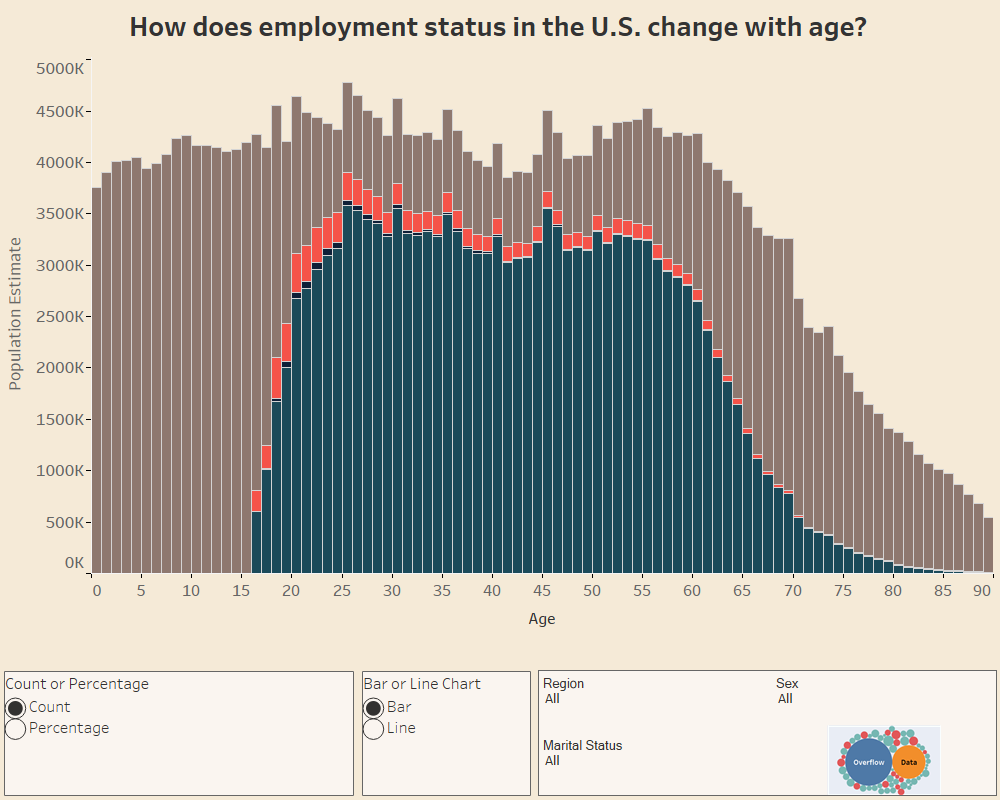
A look at how age can impact employment status in the United States.
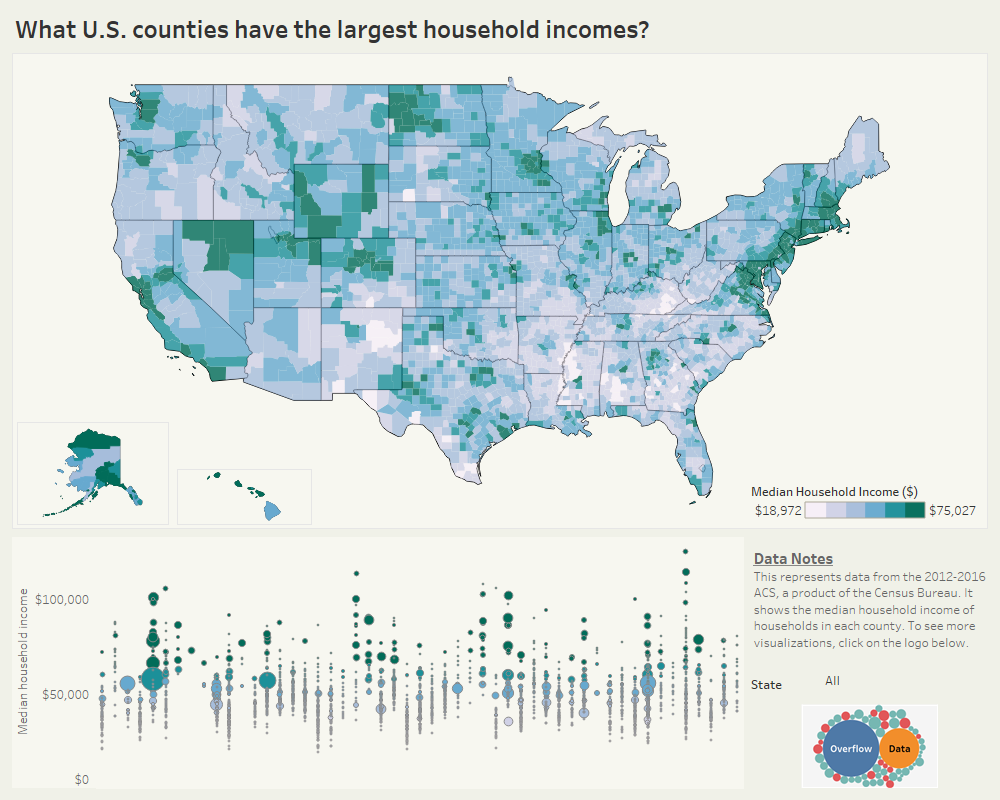
A look at how the average household income differs in each U.S. county.
Copyright © 2026 | WordPress Theme by MH Themes