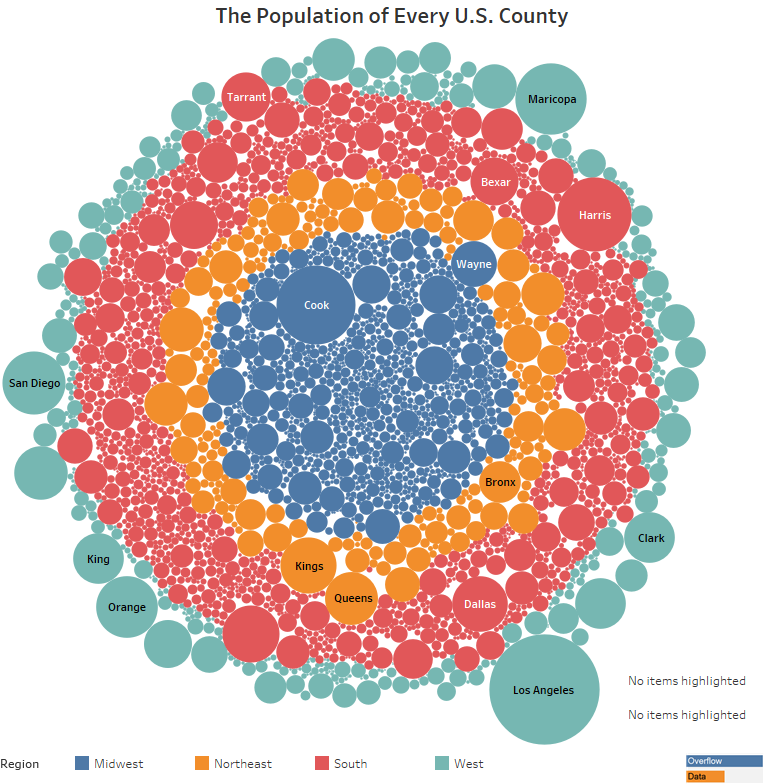
The Population of Every U.S. County
A visual look at the population size of every county in the U.S.
A visual look at the population size of every county in the U.S.
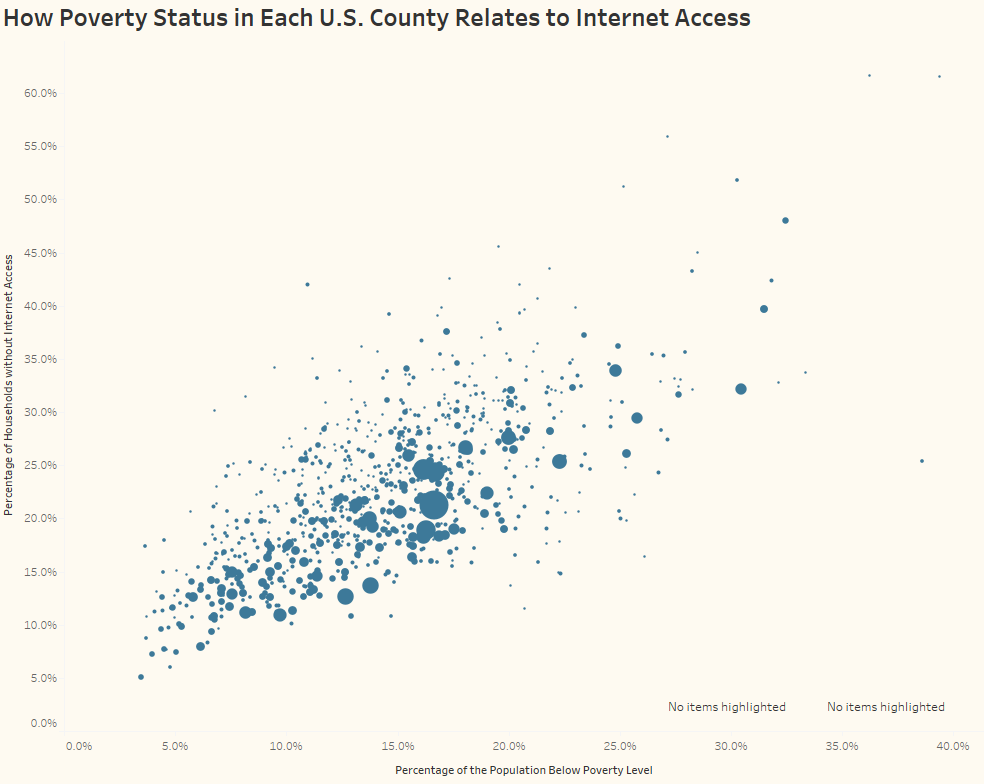
A look at the relationship between poverty and internet access in U.S. Counties.
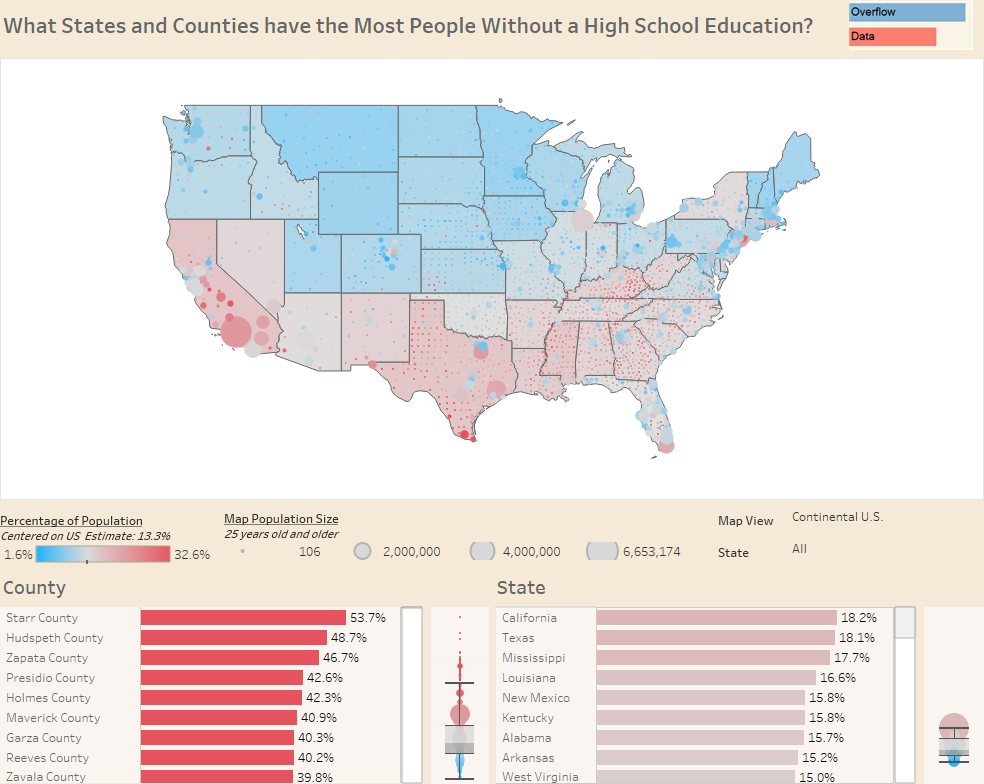
A look at how many people didn’t finish high school in all the states and counties in the U.S.
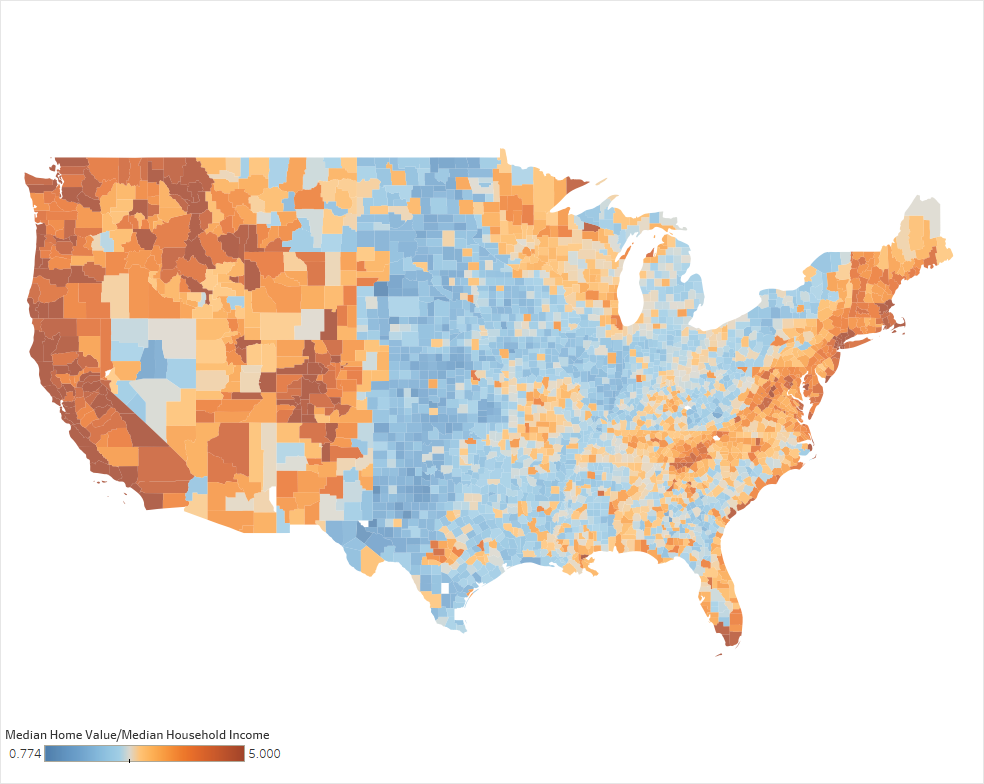
A geographical look at how median home value compares to median household income in each US county.
Copyright © 2026 | WordPress Theme by MH Themes