")
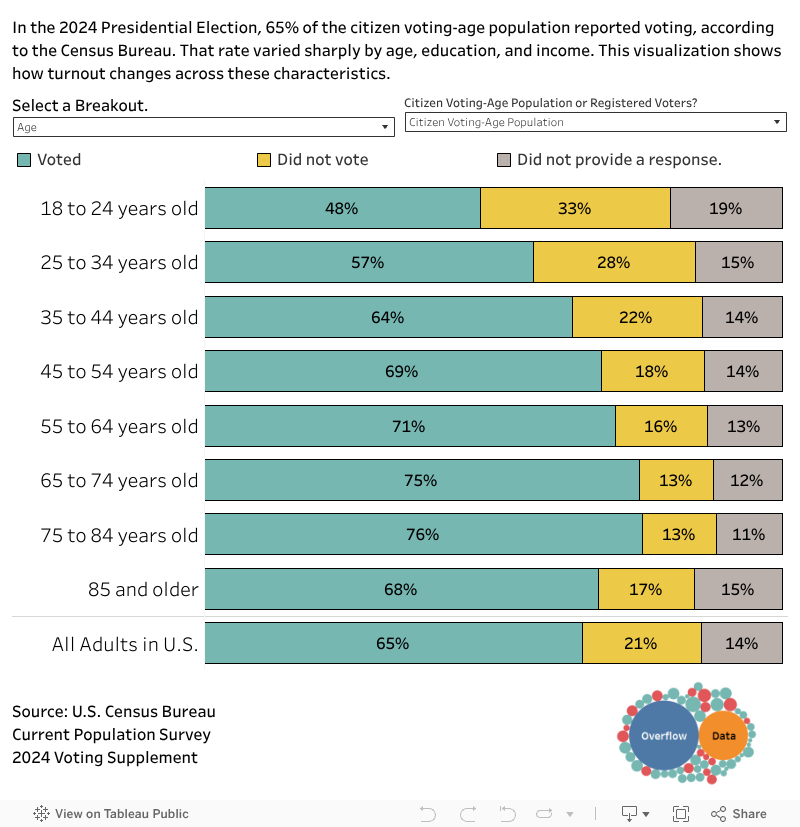
This visualization uses data from the U.S. Census Bureau’s Current Population Survey, 2024 Voting Supplement. It highlights how voting patterns vary across different demographic characteristics. The chart was created in Tableau.
Want to tell us what you think about these trends? Reach out to us on Instagram, X, or Facebook.