The Unemployment Rate in Each State Since 1990
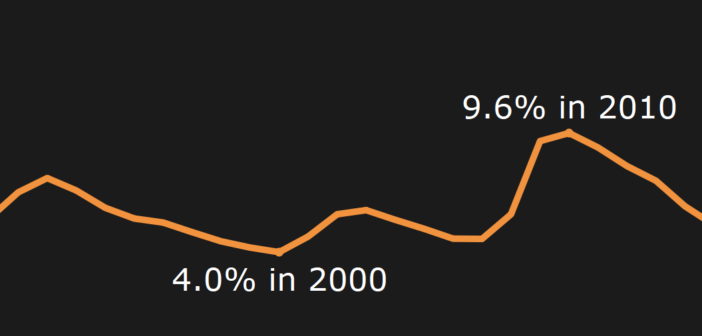
This visualization shows the unemployment rate for each state since 1990. It provided details on the low and the high point.

This visualization shows the unemployment rate for each state since 1990. It provided details on the low and the high point.
See the Pen Generate 50 State Images with Tableau and JQuery by R Chase Sawyer (@overflowds) on CodePen.

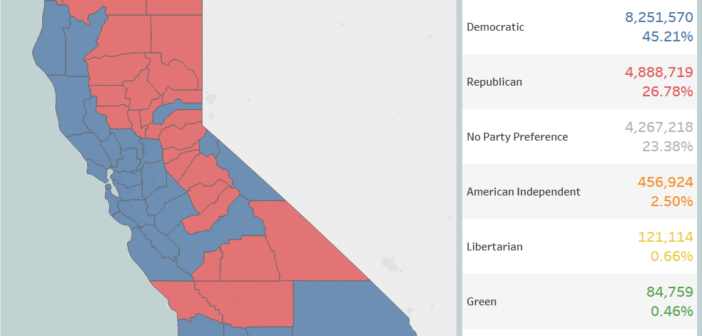
This data visualization used data provided by the California Secretary of State to show the political party preference of Californians by county.

This data visualization used data provided by the California Secretary of State to show the political party preference of Californians by county.