How are American Opinions About Premarital Sex Changing?
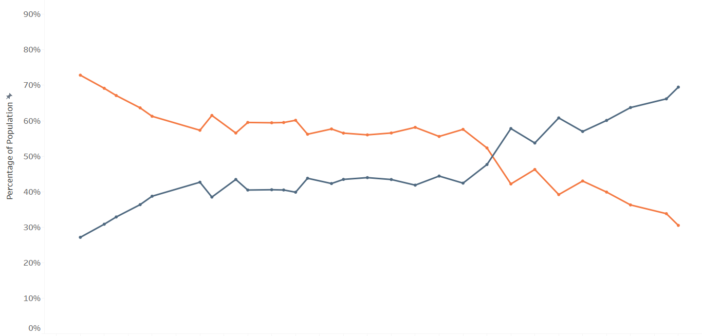
American opinions about premarital sex have seen a dramtic shift over the last few decades. See how much in this data visualization.

American opinions about premarital sex have seen a dramtic shift over the last few decades. See how much in this data visualization.

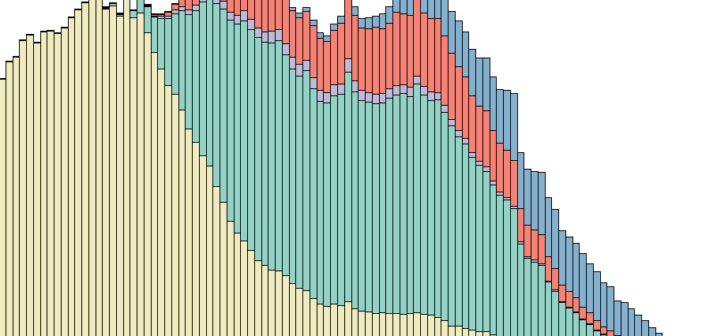
We all know that there are stages to life. This visualization gives us a look at the data behind the changes we go through.

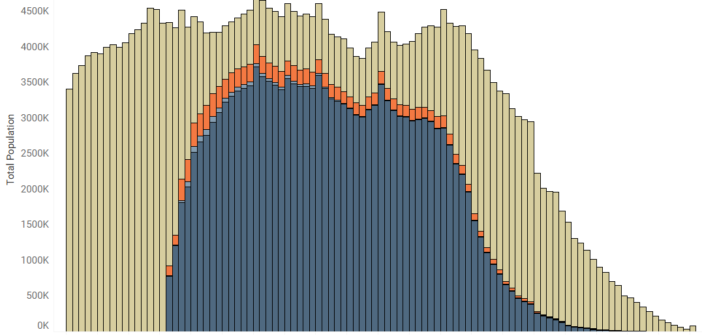
Changes in marital status certianly isn’t caused by age, but it does appear to be linked. This visualization explores that relationship.

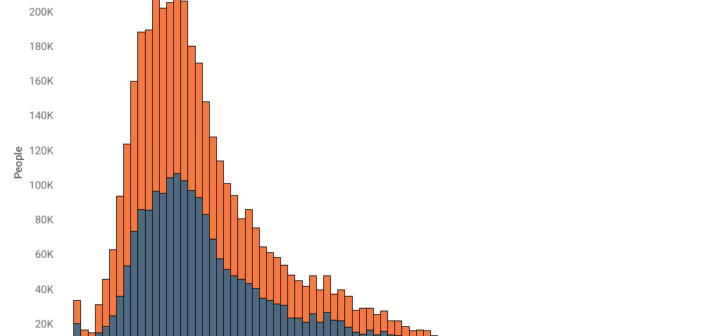
More than 4 million people got married in 2021. This data visualization looks at how old each of those people are.