How Much Have Housing Costs Increased in Each State Since 2005?
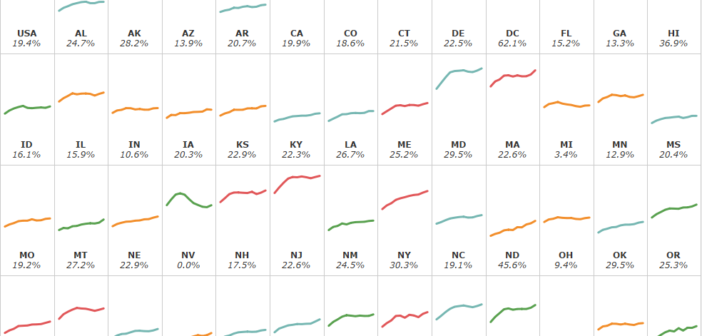
Housing costs have risen 19.4% since 2005 nationwide. Like most trends though, the data is different in every state. This visualization lets you see all the state trends in one spot.

Housing costs have risen 19.4% since 2005 nationwide. Like most trends though, the data is different in every state. This visualization lets you see all the state trends in one spot.

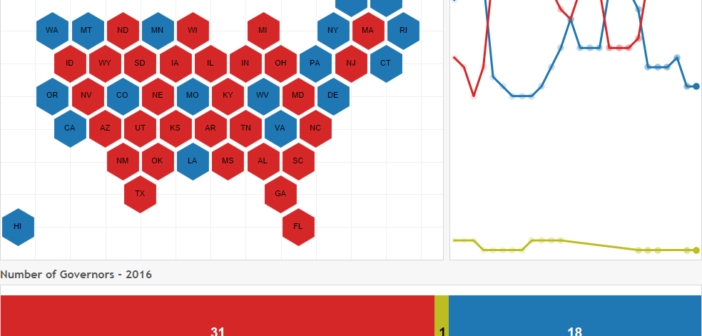
A look back at the political party preference of governors over the last 25 years.

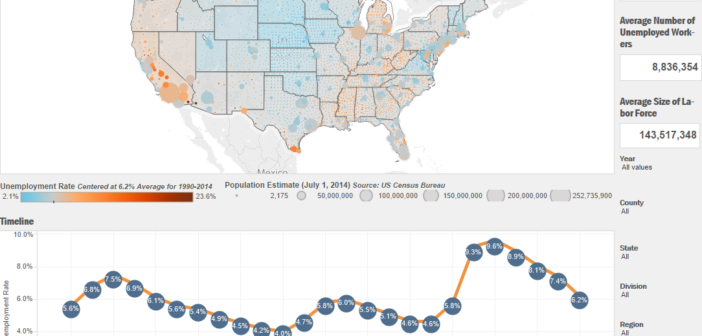
Here is a look at finalized unemployment statistics over the last 25 years for every state and county in the US.

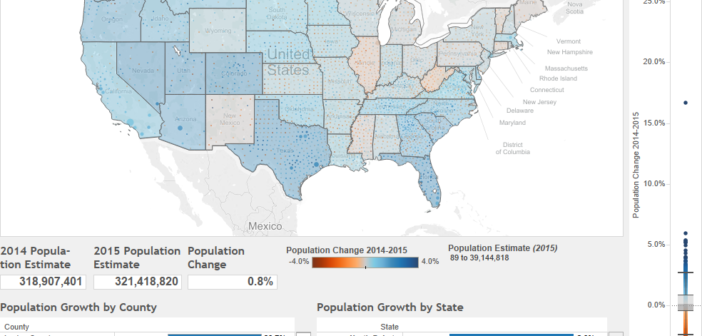
Last week the US Census Bureau released its most recent population estimates. I used this data to calculate the population growth between July 1st, 2014 and July 1st, 2015. You can use the visualization below to see how the population totals have changed in each state and county.