Browsing: Interactive Visualizations


Overflow Data’s Employment Data Mapper
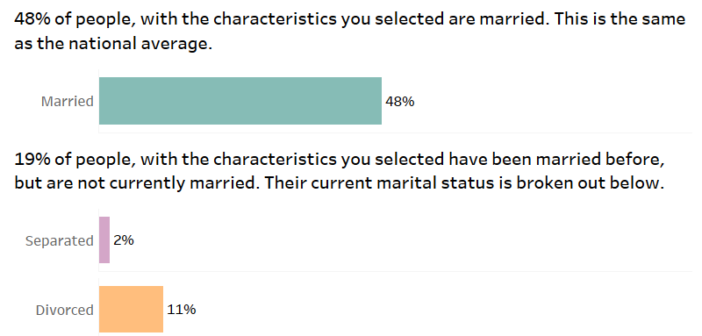
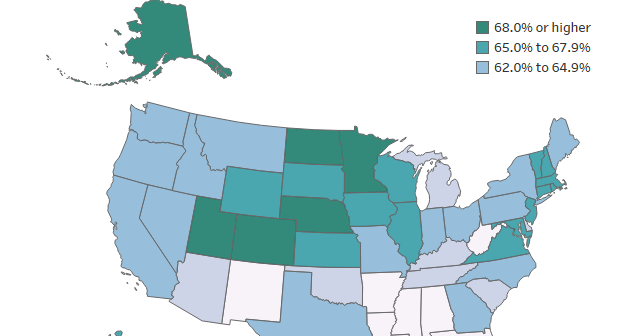
Usually, the economy is gauged based on the unemployment rate. This is only one measure of the economic strength of the labor force. This data viz lets you explore the unemployment rate, what percentage of people are part of the labor force, and what percentage of people aren’t in the labor force.

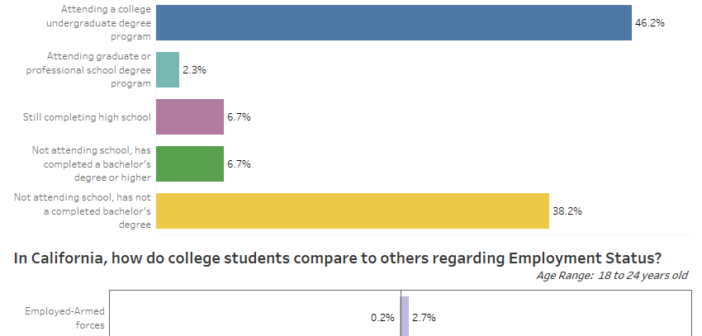
How many young adults are going to college?
Introduction I am extremely interested in demographics and the different phases in people’s lives. One of the most influential points of someone’s life is whether or not they go to college. With that in mind,…

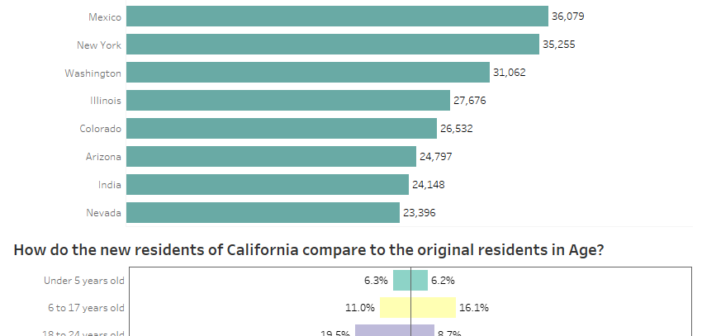
Who is moving to each state?
This tool provides policy makers, state officials, demographers, and inquisitive viewers a report of what kind of people are moving to each state.