Visualizing Data for Every County in the U.S.
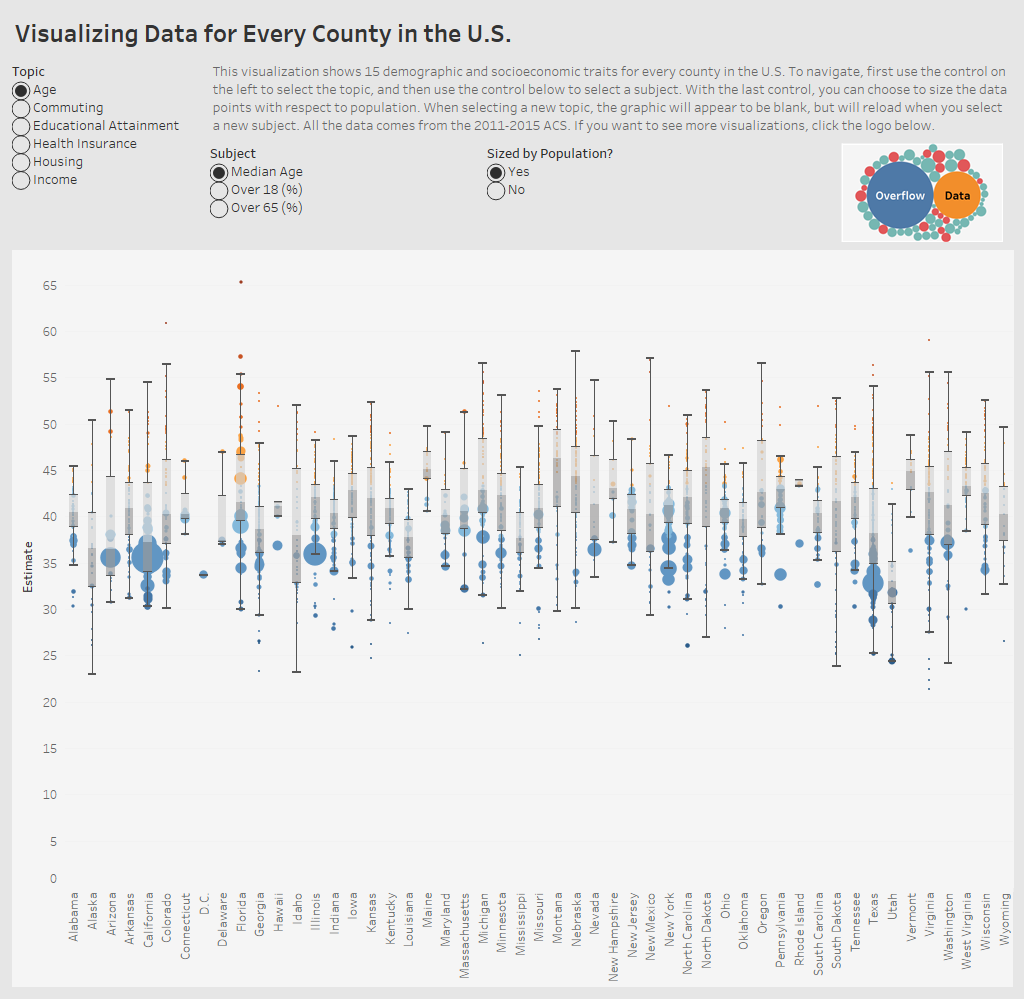
A look at how 15 demographic and socioeconomic traits differ in every county in the U.S.
A look at how 15 demographic and socioeconomic traits differ in every county in the U.S.
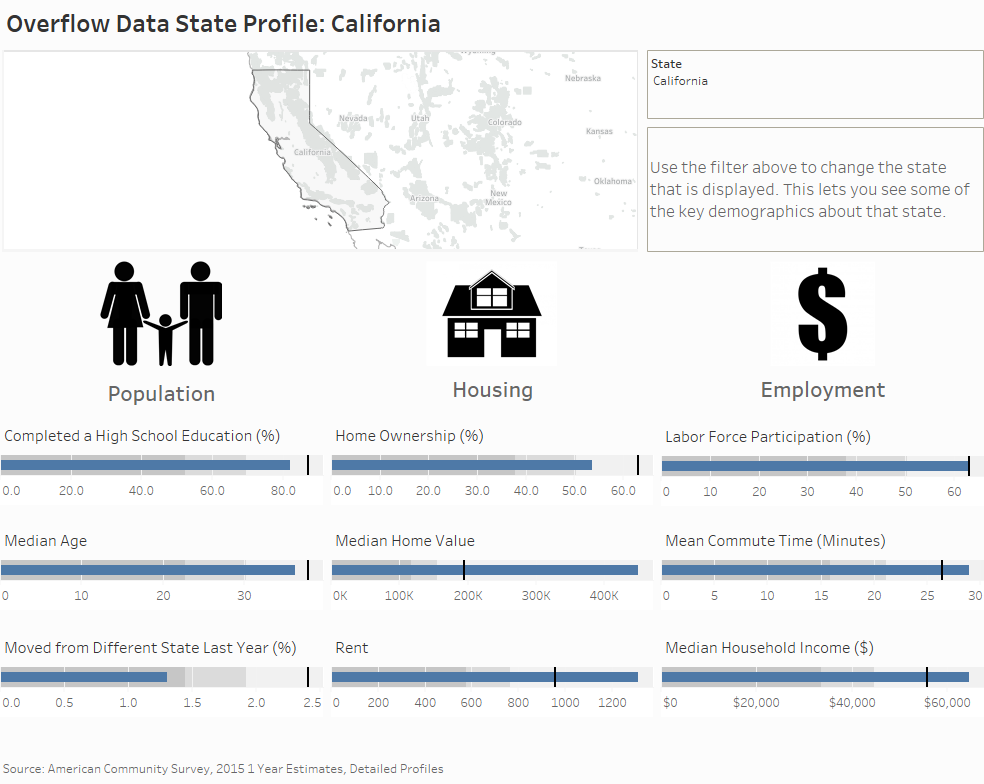
A look at how each state compares to the country as a whole with some of the demographic traits I like the most.
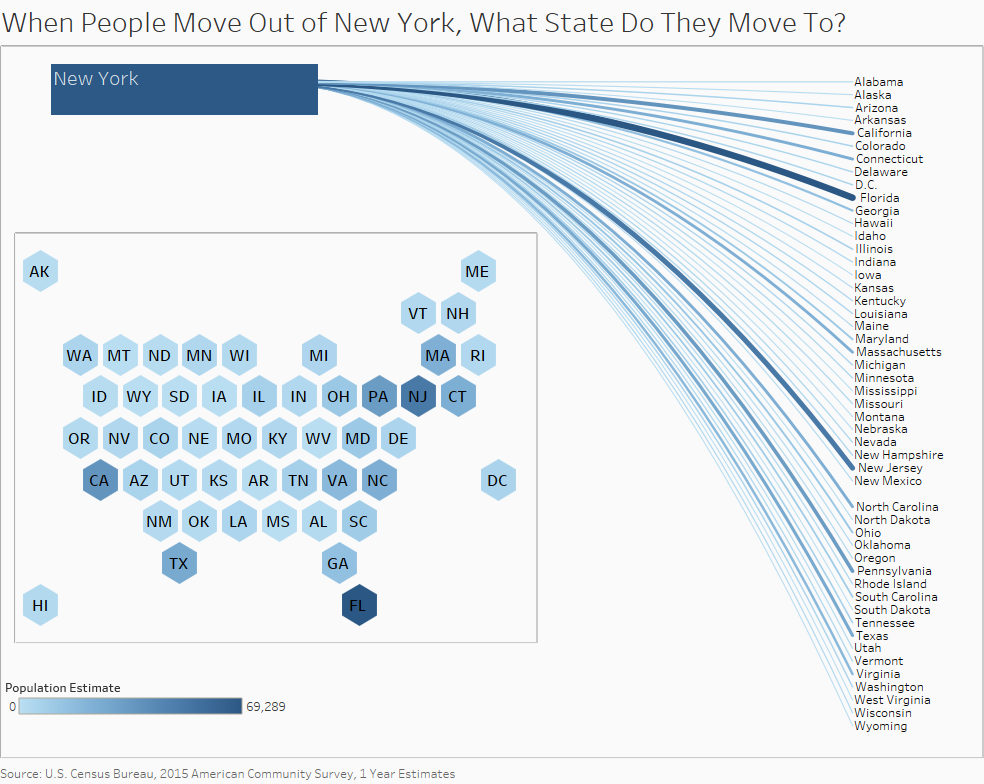
This data visualization provides a look at where people are moving when they move out of state using American Community Survey data.
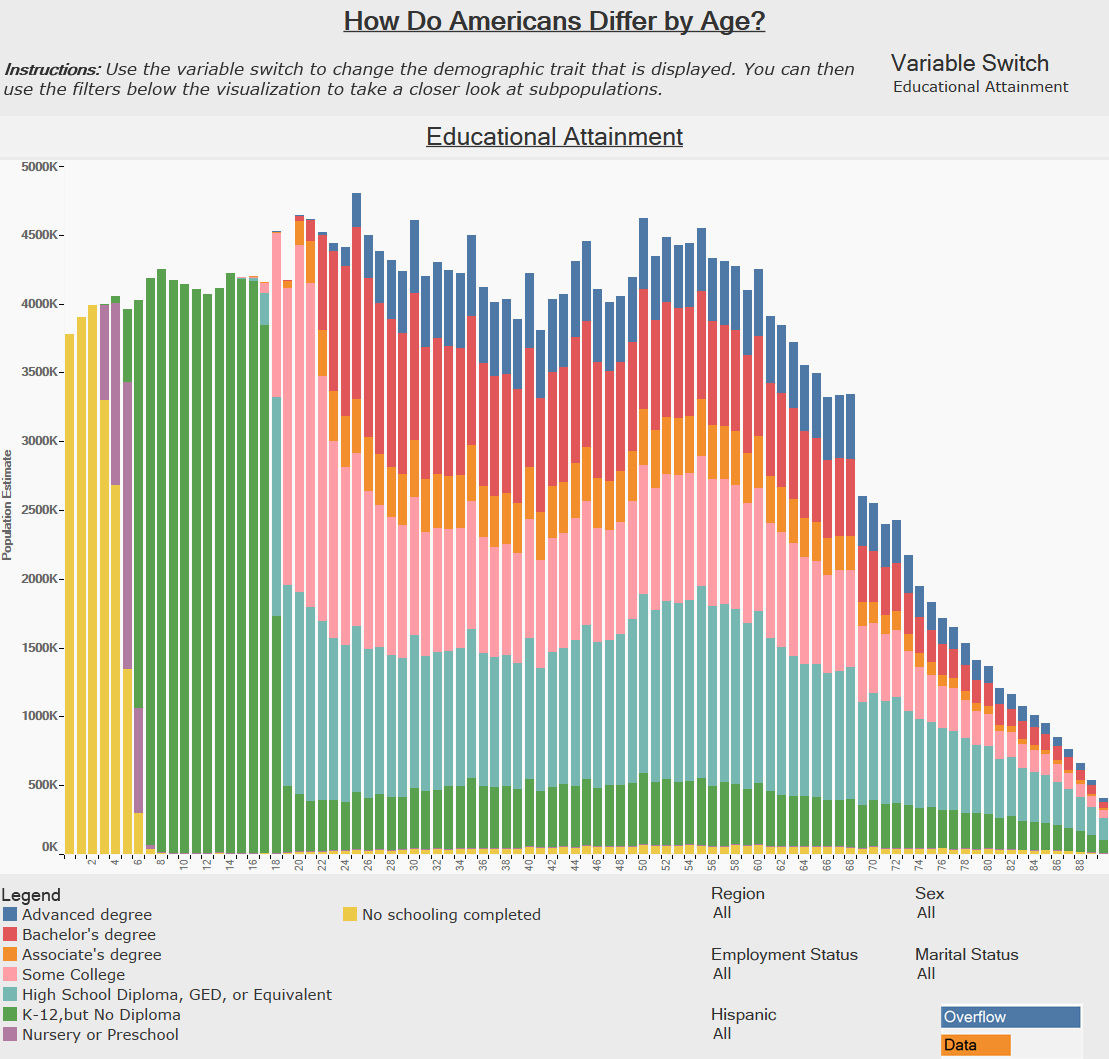
The visualization shows different demographic traits on America’s Population Pyramid.
Copyright © 2026 | WordPress Theme by MH Themes