How does rent compare to income in each U.S. metro area?
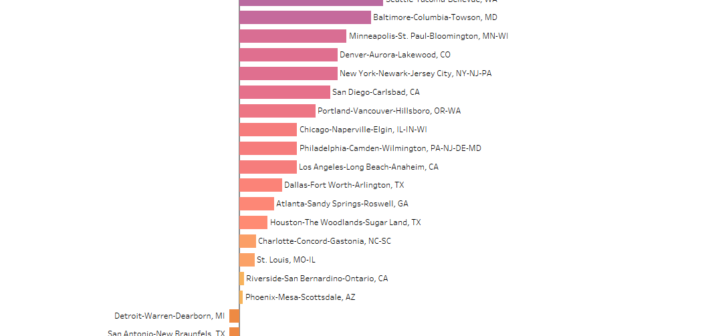
A look at the comparison between rental costs and median income in each metro area in the United States.

A look at the comparison between rental costs and median income in each metro area in the United States.

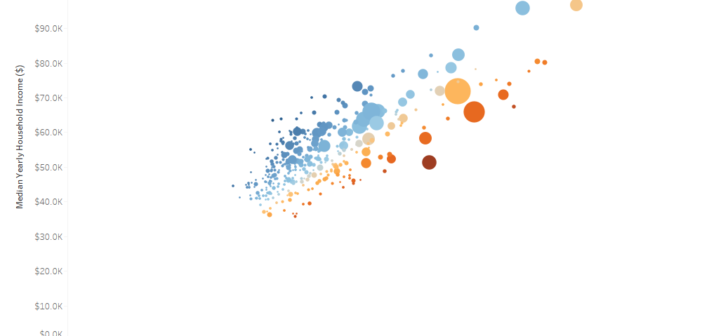
A look at how income in metro areas can differ from each other and the national average.

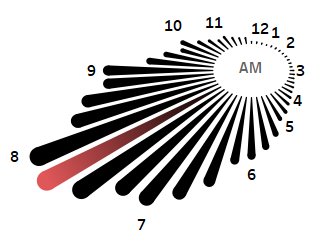
A look at what time most Americans get to work everyday.

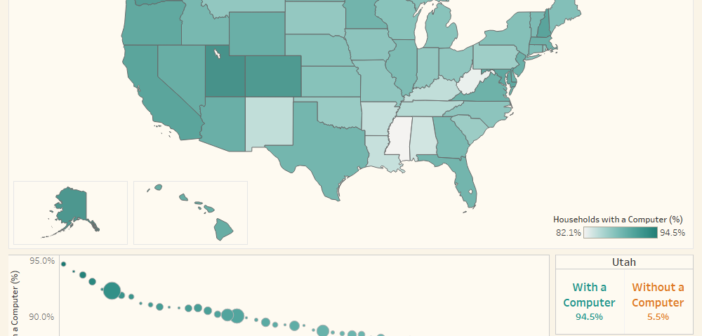
In 2016, an estimated 89.3% of American households have a computer. This visualization breaks down the differences by state.