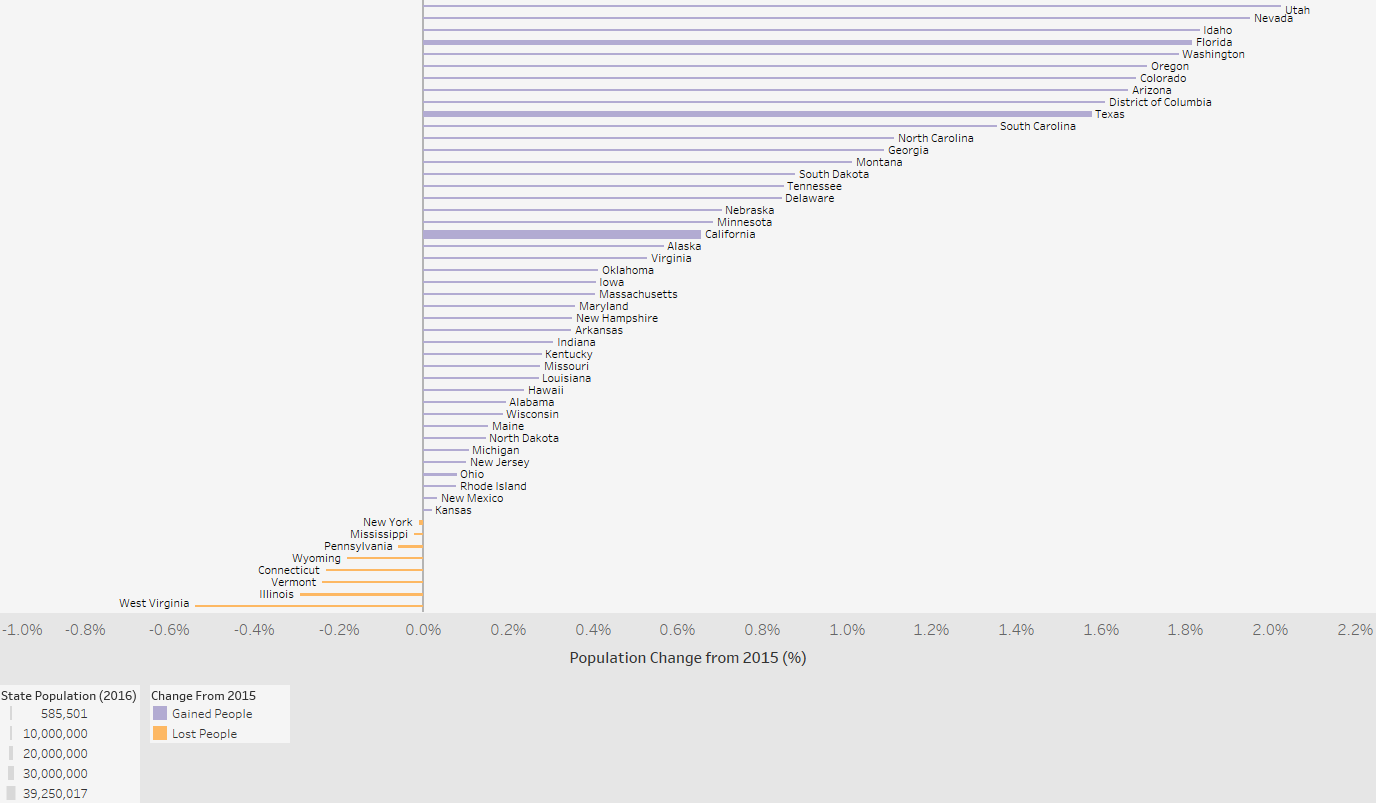
What States Grew (and Shrank) the Most in 2016?
A look at population growth for each State between 2015 and 2016.
A look at population growth for each State between 2015 and 2016.
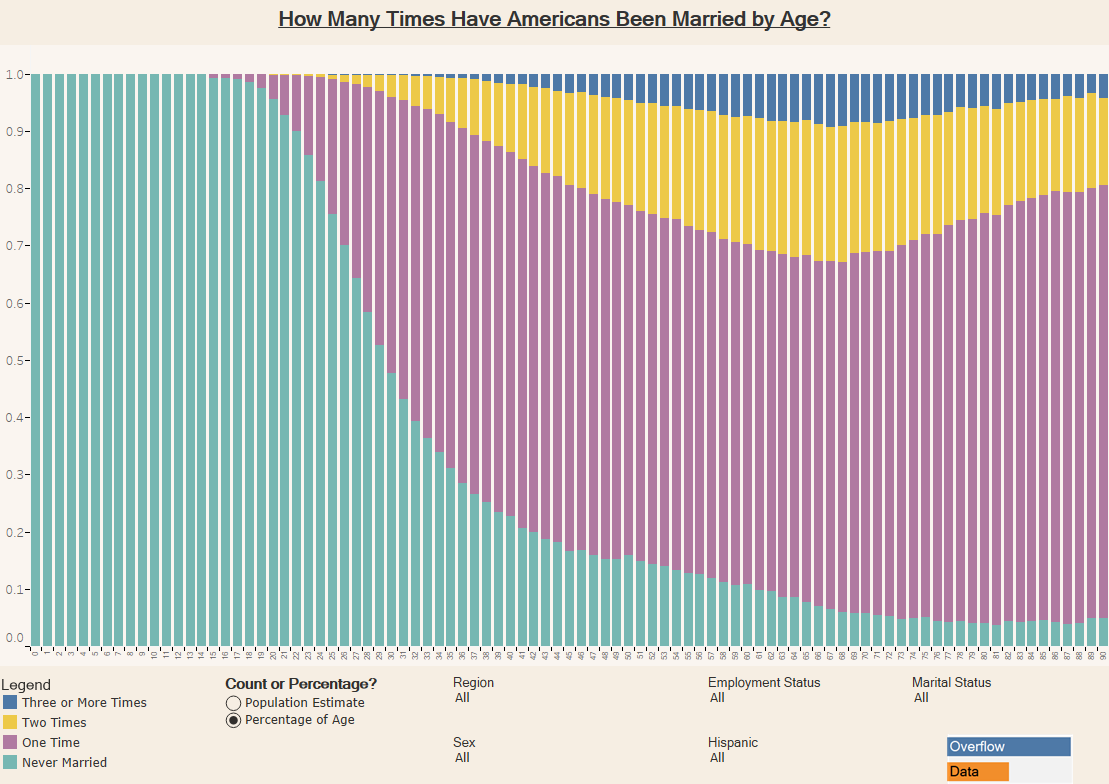
A look at how many times Americans have been married in different age groups.
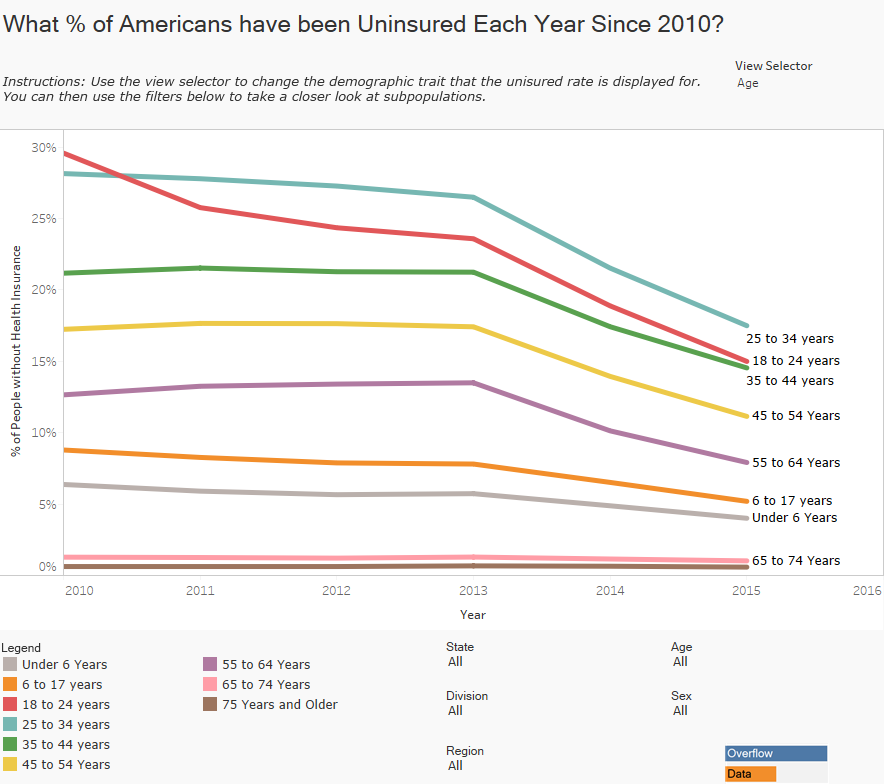
It has been reported that 9.4% of people did not have health insurance in 2015. This visualization lets you explore this rate, over time for various groups.
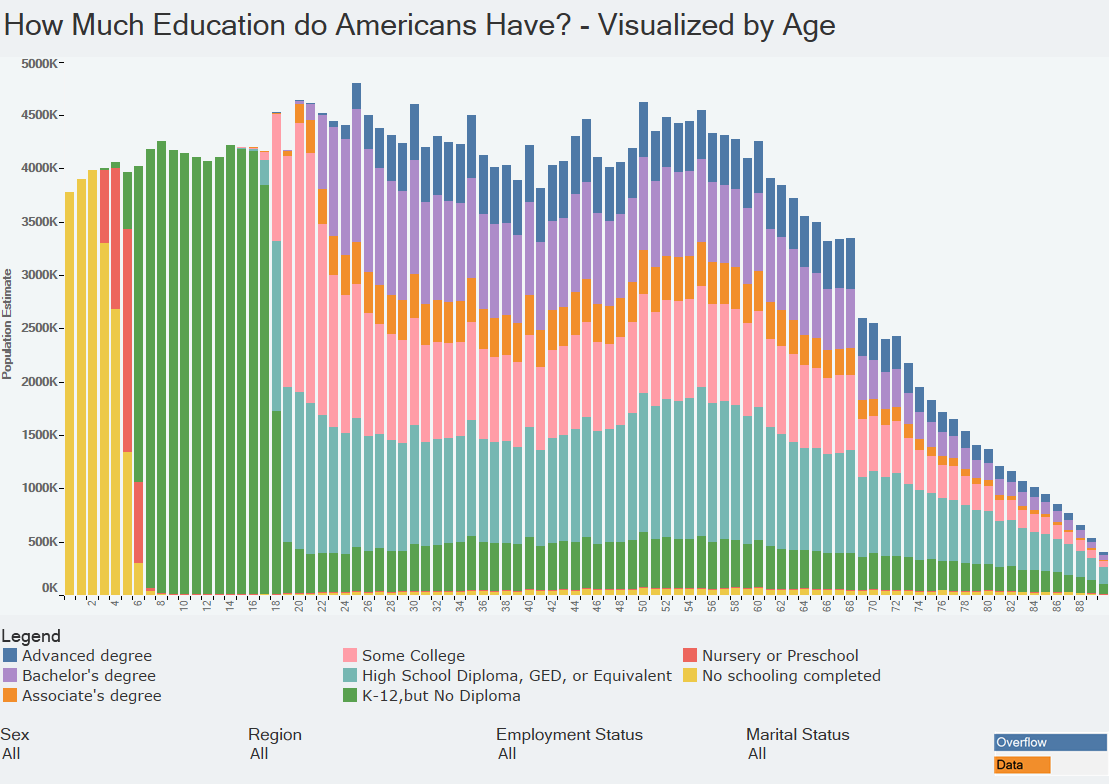
A look at the highest level of educations Americans have visualized by how old they are.
Copyright © 2026 | WordPress Theme by MH Themes