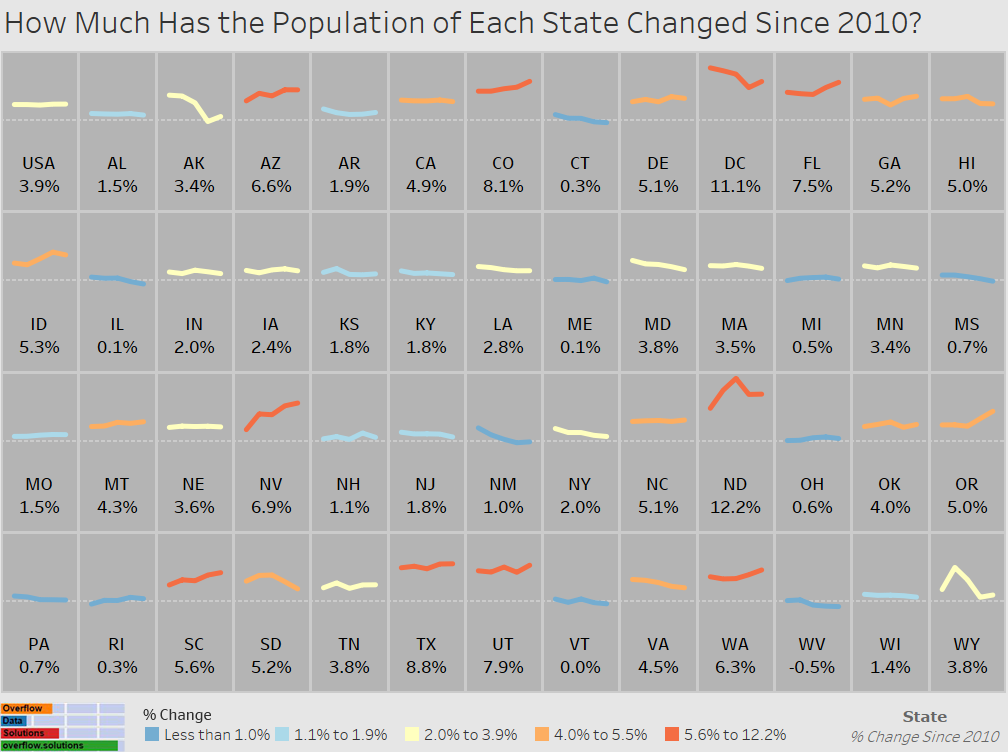
How Much Has the Population of Each State Changed Since 2010?
A look at how the population has grown (or shrunk) in each state since 2010.
A look at how the population has grown (or shrunk) in each state since 2010.
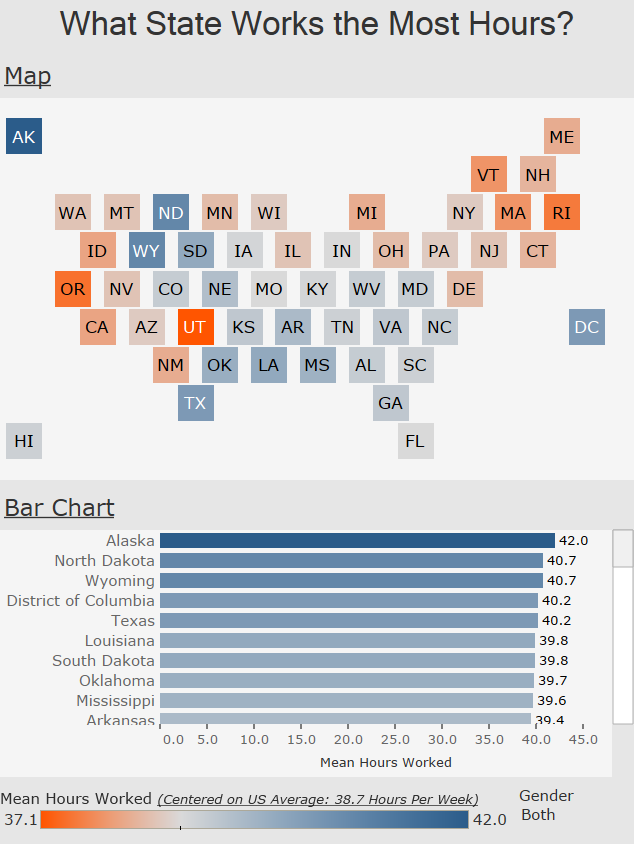
The average American worker spent 38.7 hours per week at work. Here is a look at how it differs by state.
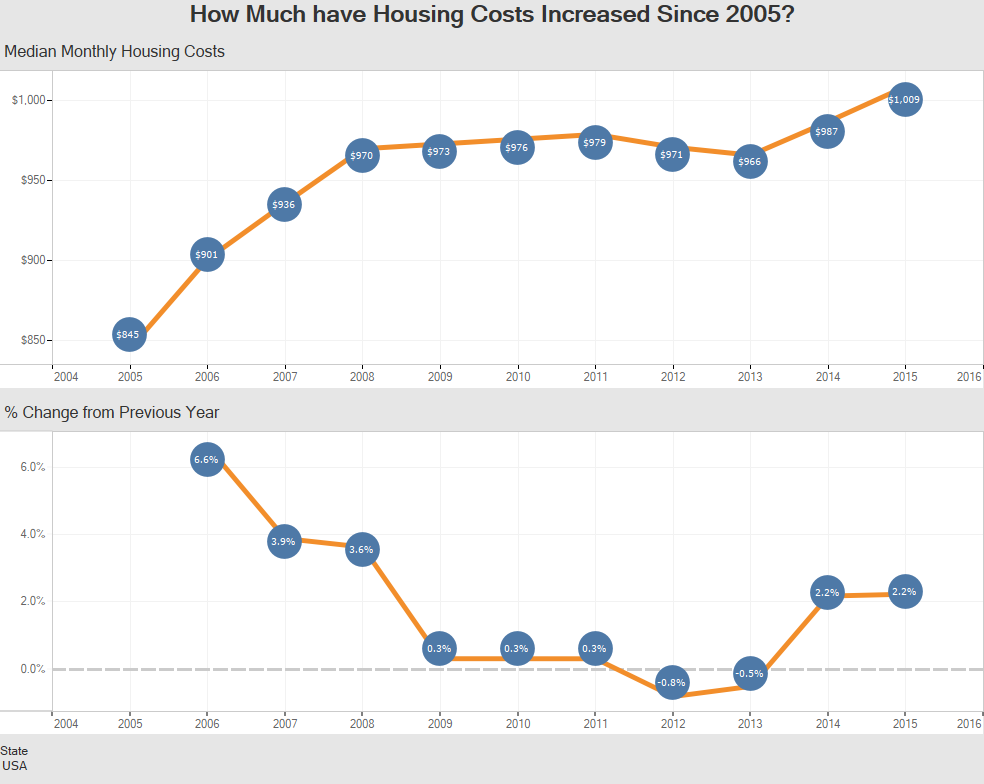
A quick look at the changes and trends in the total amount of housing costs in America.
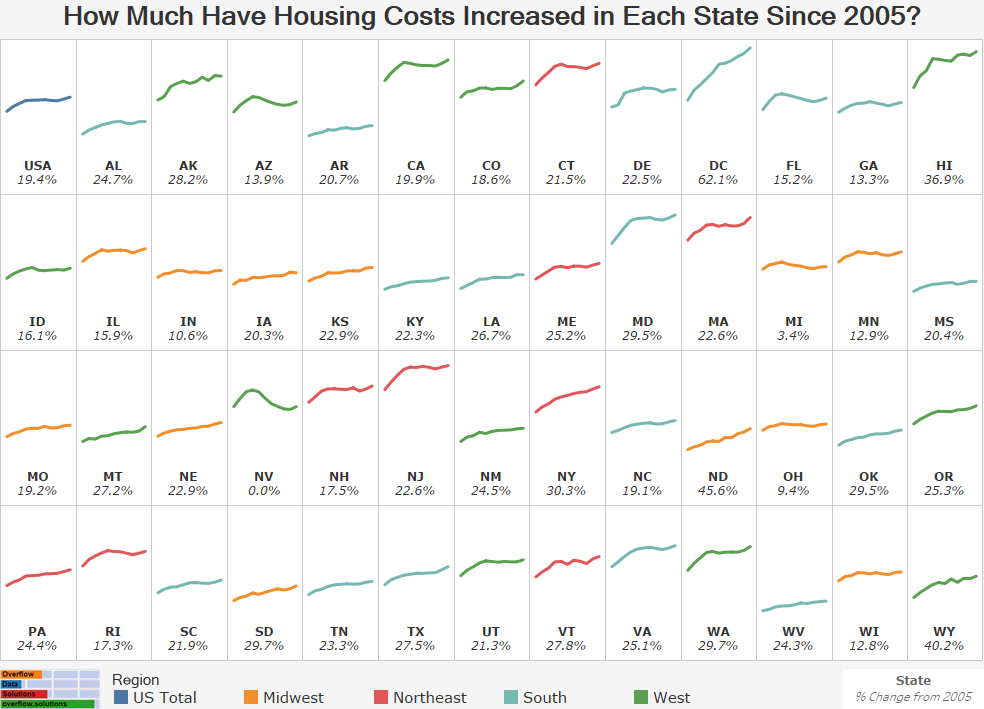
Housing costs have risen 19.4% since 2005 nationwide. Like most trends though, the data is different in every state. This visualization lets you see all the state trends in one spot.
Copyright © 2026 | WordPress Theme by MH Themes