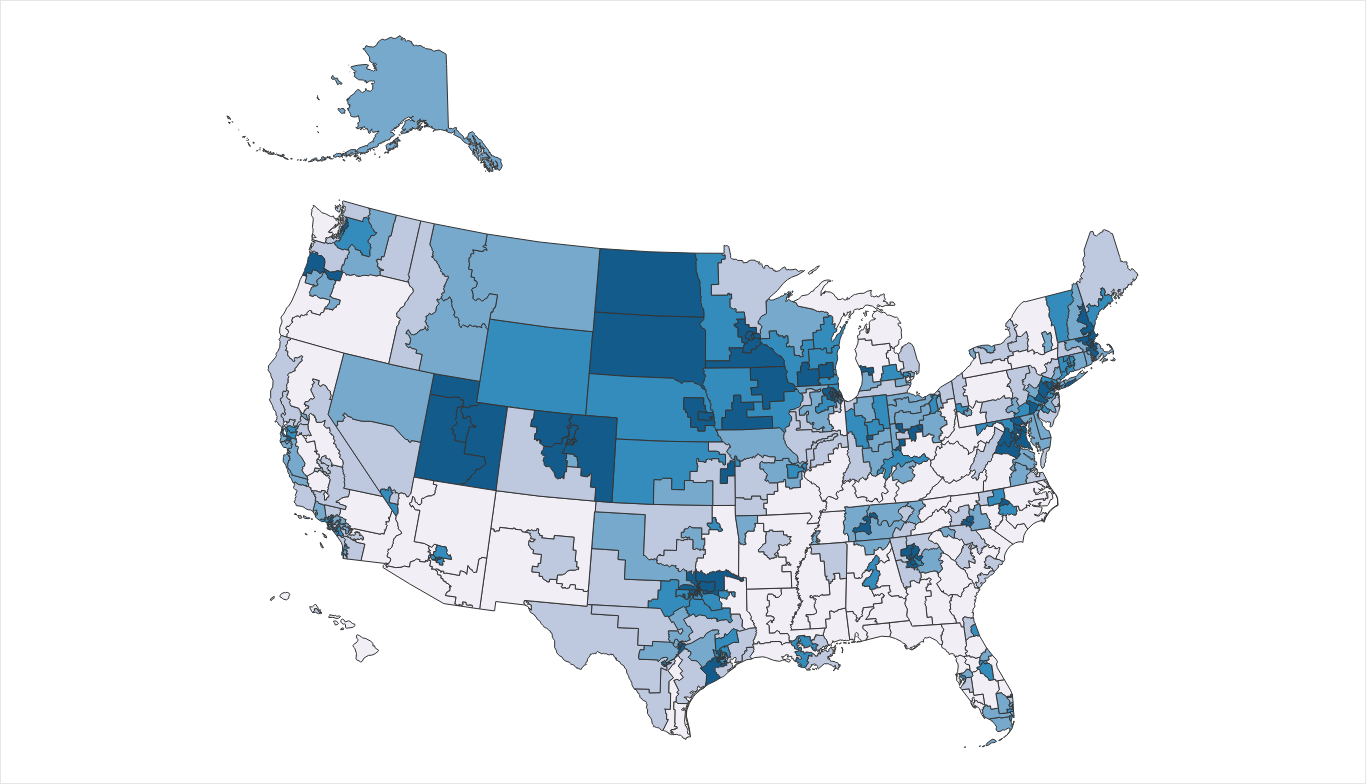
Congressional District Employment Status Explorer
Understand how employment is different in each congressional district by using this data visualization.
Understand how employment is different in each congressional district by using this data visualization.
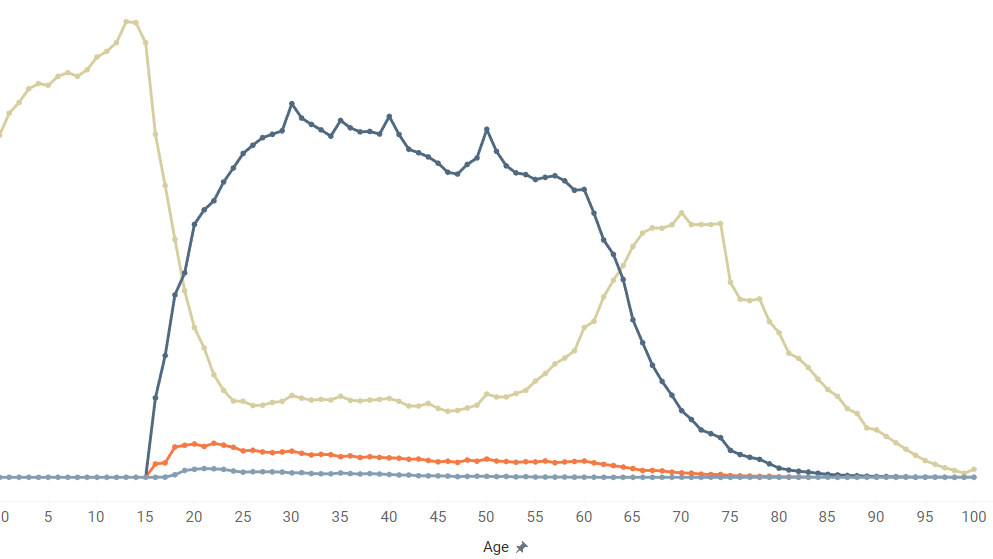
When you start and stop working has a lot to do with your age. This data viz shows how employment can differ by age for the average American.
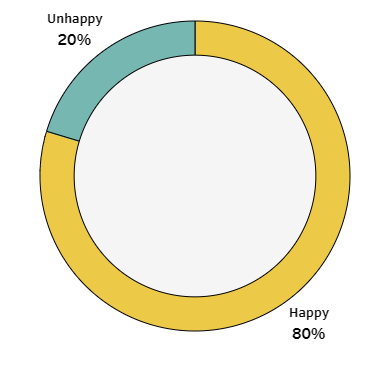
This data visualization answers the question of how many Americans are happy. It also explores how different traits are associated with happiness
Copyright © 2026 | WordPress Theme by MH Themes